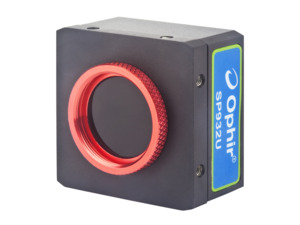
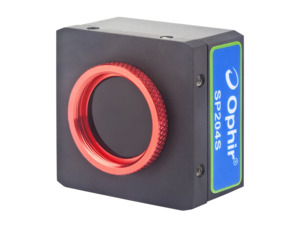
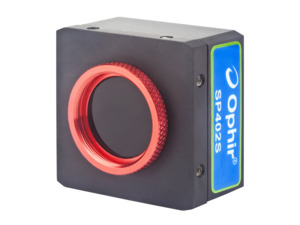
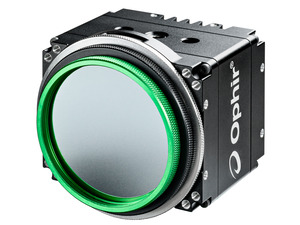
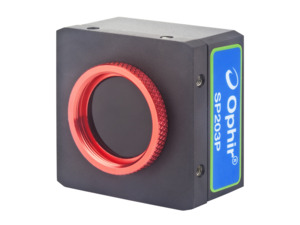
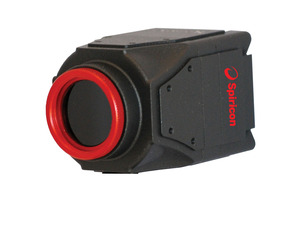
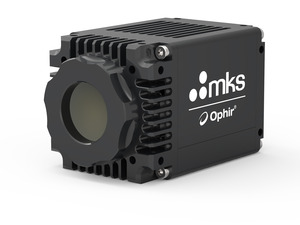
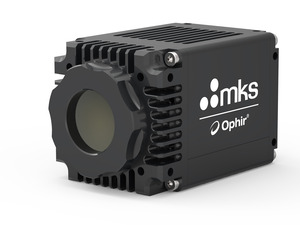
使用BeamGage的基于相机的激光光束轮廓分析仪

BeamGage®可让您用前所未有的方式来观察光束。基于相机的激光光束轮廓分析仪由一个相机和分析软件组成。通常,该分析仪需要与光束衰减或光束大小调整配件配合使用,具体使用取决于您的激光应用。基于相机的光束轮廓分析的优势在于能实时观察和测量激光光斑轮廓。BeamGage软件包括可进行复核人ISO标准的测量,具有丰富的图形界面,采用获得专利技术的UltraCal™算法,因此可实现业内最高精度的测量。

Cameras

Select or compare sensors below for more information.

Download Data Sheet.
Watch the BeamGage video

See Your Beam As Never Before:

The Graphical User Interface (GUI) of BeamGage is new. Dockable and floatable windows plus concealable ribbon tool bars empowers the BeamGage user to make the most of a small laptop display or a large, multi-monitor desktop PC.
See Your Laser Beam Profile As Never Before
Dual or single monitor setup with beam displays on one and results on the other.(Note that results can be magnified large enough to see across the room).  
Laser Beam Profile Laser Beam Profiling results
Beam only (Note results overlaid on beam profile). Beam plus results
Multiple Beam Profile Results
  • 3D displays Rotate & Tilt. All displays Pan, Zoom, Translate & Zaxis Zoom.


Multiple beam and results windows.(Note quantified profile results on 3D display & quantified 2D slices).  

Measure Your Beam As Never Before:

Ultracal: Essential, or no big deal?
If you want accurate beam measurements, you want Ultracal.
What is Ultracal?
Our patented, baseline correction algorithm helped establish the ISO 11146-3 standard for beam measurement accuracy. The problemswith cameras used in beam profile measurements are: a) The baseline, or zero, of the cameras will drift with time and temperature changes, and b) includerandom noise. Ultracal is the only beam profiler algorithm that sets the baseline to “zero”, and, in the center of the noise. (Competitiveproducts use other less sophisticated algorithms that perform a baseline subtraction, but truncate the noise below the “zero” of thebaseline. This leaves only a “positive” component, which adds a net value to all beam measurements).
Try the following on any other beam profiler product to see the inherent error if you don’t use Ultracal.
1. Measure a beam with full intensity on the profiler camera.
2. Insert a ND2 filter (100X attenuation) into the beam and measure it again.
3. Compare the results.
4. The Standard Deviation below is about 3%, which is phenomenal compared to the 100% or more of any beam profiler without Ultracal.
Beam at full intensity Beam attenuated 100X
Beam at full intensity, Width 225um, Std Dev 0.06um Beam attenuated 100X (displayed here in 2D at 16X magnitude zoom), Width 231um, Std Dev 7um
Adding the use of Automatic Aperture improves the accuracy to 1%. (The conditions of this measurement is a camera with a 50dB SNR.)
5. You normally don’t make measurements at such a low intensity. But occasionally you may have a drop in intensity of your beam and don’t want to have to adjust the attenuation. Or, you may occasionally have a very small beam of only a few tens of pixels. In both these cases, Ultracal becomes essential in obtaining accurate measurements.

Beam Measurements and Statistics

BeamGage allows you to configure as many measurements as needed to support your work, and comes standard with over 55 separatemeasurement choices. To distinguish between calculations that are based on ISO standards and those that are not, a graphical ISO logo isdisplayed next to appropriate measurements. You can also choose to perform statistical calculations on any parameter in the list.
Beam Measurements and Statistics Beam Measurements and Statistics
Small sample of possible measurements out of a list of 55 Sample of calculation results with statistics applied
And if BeamGage-Standard does not have the measurement you need the -Enterprise version permits the user to add-in custom calculations. User defined computations are treated just as the standard calculations. These custom results are displayed on the monitor, logged with results, and included on hard copy print-outs as if they were included in the original application.

Multiple Charting Options

You can create strip charts for stability observations on practically any of the calculations options available. Charts enable tracking of short or long term stability of your laser.
Multiple Charting Options
Strip chart of beam D4sigma width. Note how changing conditions affects the width repeatability.
Beam intensity changed over 10db, making noise a significant factor in measurement stability.

Beam Pointing Stability

Open the Pointing Stability Window to collect centroid and peak data from the core system and display it graphically. View a chart recorder and statistical functions in one interface:
Beam Pointing Stability

Easy to Use and Powerful

BeamGage is the only beam profiler on the market using modern Windows 7 navigation tools. The menu system of BeamGage is easy to learn and easy to use with most controls only one mouse click away. Some ribbon toolbar examples:
 
Easy to Use and Powerful
Some of the Beam Display options. (Display access options under the Tools tab on the left).
Easy to Use and Powerful
Some of the Beam Capture options.

BeamGage Main Display Screen

BeamGage Main Display Screen

Pass / Fail with Password Protection for Production Testing

BeamGage allows the user to configure the displayed calculations; set-up the screen layout and password protect the configuration from any changes. This permits secure product testing as well as data collection for Statistical Process Control (SPC), all while assuring the validity of the data.
BeamGage Main Display Screen
Failures (or successes) can be the impetus for additional actions including a TTL output signal or PC beep and the termination of further data acquisition.

Unique Features of BeamGage - Standard Power/Energy Calibration

 
Using the USB or GigE output from select Ophir power/energy meters, the BeamGage application will display measured power/energy values from the full range of Ophir thermopile, photodiode and pyroelectric sensors. Pulsed lasers can be synced up to 100Hz, or the frame rate of the triggered camera, whichever is less. This is the first time in the industry a laser power meter has been married to a laser beam profile system. BPower/Energy Calibration
  BeamGage is the only product to integrate profiling and power meter measurements

BeamMaker®; Numerical Beam Profile Generator

BeamGage contains a utility, BeamMaker, that can synthetically generate beam profile data by modeling either Laguerre, Hermite or donut laser beams in various modal configurations. BeamMaker permits the user to model a beam profile by specifying the mode, size, width, height, intensity, angle, and noise content. Once generated the user can then compare the theoretically derived measurements to measurements including experimental inaccuracies produced by the various measurement instruments and environmental test conditions. Users can now analyze expected results and confirm if measurement algorithms will accurately measure the beam even before the experiment is constructed. BeamMaker can help laser engineers, technicians and researchers understand a beam's modal content by calculating results on modeled beams for a better understanding of real laser beam profiles. BeamMaker is to laser beam analysis as a function generator is to an oscilloscope.
BeamMaker®; Numerical Beam Profile Generator
BeamMaker producing a synthetically generated Hermite TEM22 beam and displayed in both 2D and 3D

Integrated automatic Help linked into the Users Guide

Touch sensitive Tool tips are available on most all controls, and "What’s This" help can provide additional details. Confused about what something is or forgot how it works, just go to the top right corner and touch the "What’s This" help icon, then click on the control or menu item that you want more info about and you are taken to the explanation within the BeamGage Users Guide.

Multilingual

BeamGage comes with both Japanese and Chinese user interface. Country specific manuals can be downloaded from the ophiropt.com/photonics web site.

BeamGage®-Professional Version

Professional is an upgrade version of BeamGage-Standard that has all of the BeamGage-Standard features plus additional functionality.

Image Partitioning

Partitioning allows the user to subdivide the camera image into separate regions, called partitions, and compute separate beam results within each partition. When using partitioning special results items can be displayed that relate to delta values between the computed centroids or peaks of each partition. Partitioning is useful to enable separate analysis of individual beams when multiple beams impinge on the camera simultaneously. This feature is particularly useful when analyzing multiple fibers in a single bundle.
Image Partitioning
Shown is an example of the results for partition P2 and its related display frame. Observe that the selected partition is highlighted in RED. The crosshair in each partition is user controlled. The crosshair can be moved to a new position with the mouse or can be numerically positioned using the expanded controls that appear when a partition is created.

Automation Interface

BeamGage Professional provides an automation interface via .NET components to allow customers the ability to build custom applications’ that incorporate the laser beam analysis and processing power of BeamGage. The BeamGage automation interface allows developers to control BeamGage programmatically via a set of “puppet strings” known as the automation interface. The automation interface was developed to provide the ability to base control decisions for a second application on results and behaviors recognized by BeamGage. With this ability users can quickly and efficiently meet their manufacturing/analysis goals with minimum human interaction.
 
The automation interface was designed to achieve two main goals. First, to allow the BeamGage user to programmatically do what they could otherwise do via the graphical user interface (GUI). Second, to expose stable interfaces to the user that will not change, causing breaks to their dependent code. Interface examples for LabVIEW, Excel and .NET VB are included.

Custom Calculations

If BeamGage-Standard does not have the measurement you need the Professional and Enterprise versions permit the user to program-in their own set of calculations. User defined computations are treated the same as other BeamGage standard calculations.
 
These custom results are displayed on the monitor, logged with results, and included on hard copy print-outs as if they were part of the original application.
 
An example of a customer generated custom equation.
Custom Calculations
Custom Calculations


BeamGage Standard

BeamGage Professional

BeamGage® Standard

Software comparison chartBeamGage® Standard
Features OverviewUser selectable for either best "accuracy" or "ease of use"
 Supports our patented Ultracal algorithm plus Auto-setup and Auto-exposure capabilities
 Extensive set of ISO quantitative measurements
 Support for USB, GigE and Pyrocam™ IIIHR and Pyrocam™ IV cameras
 New Beam Maker® beam simulator for algorithm self validation. See below for more detailed description.
 Simultaneous 2D and 3D displays
 Multi-instance, multi-camera use
 Results synchronized to select models of Ophir power/ energy meters. Supported products include: Vega, Nova II, Pulsar, USBI and Juno, in both 32 and 64bit OS. (Quasar is not supported)
 Supports Satellite windows on multiple monitors
 Continuous zoom scaling in both 2D and 3D
 Camera ROI support on USB and GigE cameras
 Manual and Auto-aperturing to reduce background effects
 Pass/Fail on all results items, w/multiple alarm options
 Beam Pointing Stability scatter plot and stripchart results
 Full featured logging capabilities in a reloadable
Industry standard data file format
 Configurable Report Generator that allows cut and paste of results, images and settings.
 Supports English, German, Japanese and Chinese (Windows 7) and Windows 10
 Multilingual GUI in English, Japanese and Chinese.
 Administrator can lock software options for nonadministrators
Quantitative Calculations; Basic Results(per ISO 11145, 11146-1/-3, and 13694)
Power/Energy ResultsTotal power or energy (Can be calibrated or sync'd to an external power/energy meter)
 Peak power/energy density
 Min. Fluence
 Average pulse power
 Peak pulse power
 Device efficiency
 % in Aperture
Spatial ResultsPeak and Centroid locations
 Beam width
   Second Moment (D4s)
  Knife Edge 90/10
  Knife Edge (User selectable level)
  Percent of Peak (User selectable)
  Percent of Total Energy (User selectable)
  Encircled power smallest slit @ 95.4
 Moving slit (User selectable)
 Beam diameter
  Average diameter (based on x/y widths)
  Second Moment (D4s)
  Encircled power smallest aperture 86.5
  Encircled power smallest aperture (User selectable level)
 Elliptical Results
  Elliptical orientation
  Ellipticity
  Eccentricity
 Distance Measurement
  Cursor to Crosshair
  Centroid to Crosshair
 Area Results
 Beam cross-sectional area
DivergenceFocal Length method
 Far-field two-point method
 Far-field Wide Angle method
Gaussian Fit2D whole beam fits
 1D line fits
 Height
 Width X/Y
 Centroid
 Goodness of fit
 Roughness of fit
Tophat Results2D and 1D
 Flatness
 Effective Area
 Effective Power/Energy
 Fractional Effective Power/Energy
 Effective Average Fluence
 Uniformity
 Plateau Uniformity
 Edge Steepness
 1D or 2D surface inclination
Other Quantitative ItemsFrame Averaging
 Frame Summing
 Frame Reference Subtraction
 Image Convolution
 Camera signal/noise calculator
 Row and Column summing with results loggable
Beam Stability Displays and Results(per ISO 11670)
 Pointing Stability of Centroid
 Scatter Plot display w/histogram
  Mean Centroid
  Azimuth angle of the scatter
  Stability (M'/m'/S)
  Max Radius
  X/Y centroid/peak Strip chart plots
  Sample/Time controlled
  Pass/Fail limits
  Auto scaling
  Beam Width/Diameter Strip Charts with Results
  X/Y M/m beam widths plots
  Beam Diameter plot
  Power/Energy Strip Charts
  Total Power/Energy plot
  Peak fluence plot
  Avg Power plot
  Elliptical Results Strip Chart
  Elliptical orientation plot
  Ellipticity plot
  Eccentricity plot
  Mean/Std Dev/Min/Max results displayed
Custom Calculations 
Beam Profile Display OptionsUtilizes advanced hardware accelerated graphics engines. All display windows can be satellited to utilize multiple display monitors.
 Can open one each simultaneous 2D and 3D beam display windows
 Common color palette for 2D and 3D displays
 Can open X and/or Y 1D beam slice profiles overlaid onto the 2D or 3D displays or in separate windows
 Continuous software zooming in both 1D, 2D and 3D displays
 Pan to any detector location
 Continuous Z axis display magnitude scaling
 Multiple 128 color palettes user selectable
 Results items can be pasted into 2D, 3D, 1D, Pointing stability or Chart display windows.
1D FeaturesAvailable overlaid with 2D and 3D or in separate windows
 X and Y plots on separate or combined displays
 1D displays with basic results and column row summing option
 Tophat 1D displays with Tophat results
 Gaussian 1D displays with Gaussian fit results
 1D Profile display of the Gauss fit results on 1D, 2D and 3D displays
2D FeaturesContinuously zoomable and resizable displays in floatable window
 Continuous Z axis display magnitude scaling
 Zoomable to subpixel resolution for origin and cursor placements
 Pixel boundaries delineated at higher zoom magnifications
 Adjustable Cursors that can track peak or centroid
 Adjustable Crosshairs that can track peak or centroid
 Adjustable manual apertures
 Viewable Auto-aperture placement
 Displayed beam width marker
 Integrated Mouse actuated pan/zoom controls
 Separate 2D pan/zoom window to show current view in 2D beam display
 Manual or fixed origin placement
3D Features3D graphics utilize solid surface construction with lighting and shading effects
 Integrated Mouse actuated pan/zoom/tilt/rotate controls
 Selectable Mesh for drawing speed vs resolution control
 Continuously zoomable and resizable displays in floatable window
 Continuous Z axis display magnitude scaling
 User enabled backplanes with cursor projections
Statistical AnalysisPerformed on all measurement functions with on-screen display
  Choices of intervals
  Manual start/stop
  Time from 1 second to 1000 hours
  Frames from 2 to 99,999
 Measurements reported
  Current frame data, Mean, Standard Deviation, Minimum, Maximum of each calculation performed
 Controls integrated with beam stability results, scatter and strip chart plots
File typesIndustry Standard HDF5 data and setup file format which are compatible in third party applications such as MatLab and Mathmatica
 Math program and Excel compatable csv results files
 Graphics in jpg file format
 Legacy file Compatibility with LBA formats
 A user defined single file output that can contain settings, beam displays, beam profiles, charts, results, etc. in either .pdf or .xps file formats
PrintingImages, reports, results, graphs, charts, statistics and setup information
 Option to print many frames in a single operation
 WYSIWYG images
Pass/FailSet Maximum/Minimum limits on all calculations and statistics
 Red/Green font color indication on result items
 Multiple choices for indication of failed parameters, including TTL pulse for external alarm
 Master pass/fail which triggers alarm on any failure
 USB/GigE signal, beep, stop, and log alarm options
LoggingVideo Data Logging Formats: HDF5, ASCII-csv
 Results in ASCII-csv
 Pictures 2D and 3D in jpg, gif, tiff, bmp, png file formats
 Charts in ASCII-csv
 Cursor Data in ASCII-csv
 Row/Column summed in ASCII-csv
 Continuous Logging
 Time Interval Logging
 Frame Count Logging
 Periodic Sampling
 Pass/Fail Sampling
 Burst Sampling, after a user specified time interval, sample a user specified number of frames
ExportingConvert frame buffer data to third party format
 Export a user specified number of frames from the buffer
 Export Image Data: ASCII-cvs
 Export Results: ASCII-csv
 Export Picture: jpg, gif, tiff, bmp, png file formats supported
 Export Cursor Data: ASCII-cvs
 Export Row/Column summed: ASCII-cvs
 Export Image Data in Aperature
Integrated HelpPDF Operators Manual
 Context Sensitive Help
 Context Sensitive Hints
Signal Conditioning for Enhanced AccuracySpiricon’s patented Ultracal enables more accurate beam measurement and display. Ultracal takes a multi- frame average of the baseline offset of each individual pixel to obtain a baseline accurate to approximately 1/8 of a digital count. This baseline offset is subtracted from each frame, pixel by pixel, to obtain a baseline correction accurate to 1/8 digital count. Spiricon’s Ultracal method retains numbers
 less than zero that result from noise when the baseline is subtracted. Retaining fractional and negative numbers in the processed signal can increase the beam width measurement accuracy by up to 10X over conventional baseline subtraction and clip level methods. Spiricon's Ultracal conforms to the best method described in ISO 11146-3:2004
Frame AveragingUp to 256 frames can be averaged for a signal-to-noise ratio, S/N, improvement of up to 16X (Noise is averaged up to 1/256th [8 fractional bits]). Data is processed and stored in a 32bit format.
Frame SummingUp to 256 frames can be summed to pull very weak signals out of the noise.
 Due to the precise nature of Ultracal baseline setting, (i.e., a retention of both positive and negative noise components) summing of frames can be performed without generating a large offset in the baseline.
Convolution (Adjacent Pixel Averaging)Choice of 5 convolution algorithms for spatial filtering for both display and calculations. Spatial filtering improves the visual S/N.
Beam Maker®Beam Maker is a new feature that allows the user to model both Laguerre-Gaussian and Hermite-Gaussian laser beams in various modal configurations. With these models you have verification and validation tools that allows not only OSI but also the end user to verify BeamGage’s basic beam width measurement algorithms. It can also be used to model laser beams with special input conditions such as signal-to-noise, background offset, and bits per pixel resolution. This allows the user to better understand the accuracy of measurements made under both optimum and adverse conditions. This tool provides the user with a method to validate algorithms against current ISO standards and methods. It can also be used to validate third party algorithms by making the output data available for use in third party applications.
Camera FeaturesCamera features are governed by the capabilities of the various cameras that will interfaced with these software products, and second by which of these camera features are implemented in the software. This section will describe typical camera features supported in the application.
 Black Level Control (used by Ultracal and Auto-X and Auto-setup)
 Gain Control (used by Auto-X and Auto-setup)
 Exposure Control (used by Auto-X and Auto-setup)
 User Programmable ROI
 Pixel Binning
 Pixel Sampling
 Bits per pixel setting
 External Trigger Input
 Trigger Delay
 Strobe Output
 Strobe Delay
 External Trigger Probe
 Internal Trigger Probe
Camera related features in the applicationsThese are features related to but not generally dependant upon the camera design.
 Gamma Correction
 Gain Correction
 Bad Pixel Correction
 Lens Applied Option
 Pixel scale settings
 Magnification settings
 Frame buffer settings
 Ultracal
 Enable Auto-X (auto exposure control)
 Perform an Auto-Setup
 8/10/12/14/16 bits per pixel
 Select Format or ROI
 Measure S/N ratio
Trigger, Capture and Synchronization MethodsCapture methods are features related to the application while Synchronization methods relate more to the abilities of the specific camera. NOTE: Frame capture rates are determined by many factors and are not guarenteed for any specific operating configuration.
 Trigger modes
  CW - captures continuously, see Capture Options below
  Trigger-In from laser: Trigger pulses supplied to the camera
  Strobe-Out to laser: Strobe pulses output from the camera
  Video Trigger: Frame captured and displayed only when the camera sees a signal greater than a user set level
 Capture options
  Capture options are redefined and are approached in a different manner than older products. The items listed below will allow for all of the previous methods but with more flexibility than ever before.
  Results Priority: Results priority will slow the capture rate to be in sync with the computational results and display updates
  Frame Priority: Frame priority will slow results and display updating to insure that frames are collected and stored in the frame buffer as fast as possible (replaces block mode)
  Stop After: Will collect a set number of frames and then stop (replaces Single-Shot mode)
  Periodic: Will collect frame at a programmed periodic rate.
  Periodic Burst: Will collect frames in a Burst at programmed periodic rates
 Post processing is still available but is done via a different mechanism and is limited to only data file sources.
Video PlaybackVideo playback, post processing and post analysis
 User customizable playback rates
 Video file quick pan/search controls
 Whole video file playback looping with sub-selection looping
 Playback Video produced by logging
 Almost all measurements can be performed on video files
System Requirements
PC computer running Windows 7 (64) and Windows 10
Laptop or Desktop
 Not all cameras run in all Microsoft OS versions, see camera section for specifics
 GHz Pentium style processor, dual core recommended
 Minimum 2GB RAM (4GB required for L11059 camera)
 Accelerated Graphics Processor
 Hard drive space suitable to hold the amount of video data you expect to store (50-100 GB recommended)

BeamGage® Professional

All Features in Standard Plus Those highlighted in Yellow

Software comparison chartBeamGage® Professional
Features OverviewUser selectable for either best "accuracy" or "ease of use"
 Supports our patented Ultracal algorithm plus Auto-setup and Auto-exposure capabilities
 Extensive set of ISO quantitative measurements
 Supports InGaAs and large format L11059 cameras
 New Beam MakerTM beam simulator for algorithm self validation. See below for more detailed description.
 Simultaneous 2D and 3D displays
 Multi-instance multi-camera use
 Results synchronized to select models of Ophir power/ energy meters. Supported products include: Vega, Nova II, Pulsar, USBI and Juno, in both 32 and 64bit OS. (Quasar is not supported)
 Supports Satellite windows on multple monitors
 Continuous zoom scaling in both 2D and 3D
 Window partitioning to allow analysis of multiple beams from a single camera image
 Camera ROI support on USB and GigE cameras
 Manual and Auto-aperturing to reduce background effects
 Pass/Fail on all results items, w/multiple alarm options
 Beam Pointing Stability scatter plot and stripchart results
 Full featured logging capabilities that are reloadable
Industry standard data file format
 Configurable Report Generator that allows cut and paste of results, images and settings.
 .NET Automation interface that allows for full remote control
Examples in LabView, Excel and .Net VB
 Supports English, German, Japanese and Chinese (Windows 7) and Windows 10
 Multilingual GUI in English, Japanese and Chinese.
 Administrator can lock software options for nonadministrators
Quantitative Calculations; Basic Results(per ISO 11145, 11146-1/-3, and 13694)
Power/Energy ResultsTotal power or energy (Can be calibrated or sync'd to an external power/energy meter)
 Peak power/energy density
 Min. Fluence
 Average pulse power
 Peak pulse power
 Device efficiency
 % in Aperture
Spatial ResultsPeak and Centroid locations
 Beam width
   (Second Moment (D4s)
  Knife Edge 90/10
  Knife Edge (User selectable level)
  Percent of Peak (User selectable)
  Percent of Total Energy (User selectable)
  Encircled power smallest slit @ 95.4
 Moving slit (User selectable)
 Beam diameter
  Average diameter (based on x/y widths)
  Second Moment (D4s)
  Encircled power smallest aperture 86.5
  Encircled power smallest aperture (User selectable level)
 Elliptical Results
  Elliptical orientation
  Ellipticity
  Eccentricity
 Distance Measurement
  Cursor to Crosshair
  Centroid to Crosshair
 Area Results
 Beam cross-sectional area
DivergenceFocal Length method
 Far-field two-point method
 Far-field Wide Angle method
Gaussian Fit2D whole beam fits
 1D line fits
 Height
 Width X/Y
 Centroid
 Goodness of fit
 Roughness of fit
Tophat Results2D and 1D
 Flatness
 Effective Area
 Effective Power/Energy
 Fractional Effective Power/Energy
 Effective Average Fluence
 Uniformity
 Plateau Uniformity
 Edge Steepness
 1D or 2D surface inclination
Other Quantitative ItemsFrame Averaging
 Frame Summing
 Frame Reference Subtraction
 Image Convolution
 Camera signal/noise calculator
 Row and Column summing with results loggable
 Scalable Intensity Histogram, exportable
 X or Y axial off axis image correction
Beam Stability Displays and Results(per ISO 11670)
 Pointing Stability of Centroid
 Scatter Plot display w/histogram
  Mean Centroid
  Azimuth angle of the scatter
  Stability (M'/m'/S)
  Max Radius
  X/Y centroid/peak Strip chart plots
  Sample/Time controlled
  Pass/Fail limits
  Auto scaling
  Beam Width/Diameter Strip Charts with Results
  X/Y M/m beam widths plots
  Beam Diameter plot
  Mean/Std Dev/Min/Max results displayed
  Power/Energy Strip Charts
  Total Power/Energy plot
  Peak fluence plot
  Avg Power plot
  Elliptical Results Strip Chart
  Elliptical orientation plot
  Ellipticity plot
  Eccentricity plot
  Mean/Std Dev/Min/Max results displayed
Custom CalculationsUser can program-in own set of calculations
Beam Profile Display OptionsUtilizes advanced hardware accelerated graphics engines. All display windows can be satellited to utilize multiple display monitors.
 Can open one each simultaneous 2D and 3D beam display windows
 Common color palette for 2D and 3D displays
 Can open X and/or Y 1D beam slice profiles overlaid onto the 2D or 3D displays or in separate windows
 Continuous software zooming in both 1D, 2D and 3D displays
 Pan to any detector location
 Continuous Z axis display magnitude scaling
 Multiple 128 color palettes user selectable
 Results items can be pasted into 2D, 3D, 1D, Pointing stability or Chart display windows.
 Able to partition the camera imager into multiple regions with separate results.
1D FeaturesAvailable overlaid with 2D and 3D or in separate windows
 X and Y plots on separate or combined displays
 1D displays with basic results and column row summing option
 Tophat 1D displays with Tophat results
 Gaussian 1D displays with Gaussian fit results
 1D Profile display of the Gauss fit results on 1D, 2D and 3D displays
2D FeaturesContinuously zoomable and resizable displays in floatable window
 Continuous Z axis display magnitude scaling
 Zoomable to subpixel resolution for origin and cursor placements
 Pixel boundaries delineated at higher zoom magnifications
 Adjustable Cursors that can track peak or centroid
 Adjustable Crosshairs that can track peak or centroid
 Adjustable manual apertures
 Viewable Auto-aperture placement
 Displayed beam width marker
 Integrated Mouse actuated pan/zoom controls
 Separate 2D pan/zoom window to show current view in 2D beam display
 Manual or fixed origin placement
 Ability to create partitions using the manual aperture controls
3D Features3D graphics utilize solid surface construction with lighting and shading effects
 Integrated Mouse actuated pan/zoom/tilt/rotate controls
 Selectable Mesh for drawing speed vs resolution control
 Continuously zoomable and resizable displays in floatable window
 Continuous Z axis display magnitude scaling
 User enabled backplanes with cursor projections
PartitioningUsers can subdivide the imager into separate beam measurement regions. All enabled results are computed inside of each partition
 The manual aperture is used to define and create rectangular partition
 When partitioning is enabled some new results items will be enabled
 Centroid measurements between beams in each partition can be performed
 Partitioned imagers must have a single origin common to all partitions. All coordinate results are globally referenced to this single origin
Statistical AnalysisPerformed on all measurement functions with on-screen display
  Choices of intervals
  Manual start/stop
  Time from 1 second to 1000 hours
  Frames from 2 to 99,999
 Measurements reported
  Current frame data, Mean, Standard Deviation, Minimum, Maximum of each calculation performed
 Controls integrated with beam stability results, scatter and strip chart plots
File typesIndustry Standard HDF5 data and setup file format which are compatible in third party applications such as MatLab and Mathmatica
 Math program and Excel compatable csv results files
 Graphics in jpg file format
 Legacy file Compatibility with LBA formats
 A user defined single file output that can contain settings, beam displays, beam profiles, charts, results, etc. in either .pdf or .xps file formats
PrintingImages, reports, results, graphs, charts, statistics and setup information
 Option to print many frames in a single operation
 WYSIWYG images
Pass/FailSet Maximum/Minimum limits on all calculations and statistics
 Red/Green font color indication on result items
 Multiple choices for indication of failed parameters, including TTL pulse for external alarm.
 Master pass/fail which triggers alarm on any failure
 USB/GigE signal, beep, stop, and log alarm options
LoggingVideo Data Logging Formats: HDF5, ASCII-csv
 Results in ASCII-csv
 Pictures 2D and 3D in jpg, gif, tiff, bmp, png file formats
 Charts in ASCII-csv
 Cursor Data in ASCII-csv
 Row/Column summed in ASCII-csv
 Continuous Logging
 Time Interval Logging
 Frame Count Logging
 Periodic Sampling
 Pass/Fail Sampling
 Burst Sampling, after a user specified time interval, sample a user specified number of frames
ExportingConvert frame buffer data to third party format
 Export a user specified number of frames from the buffer
 Export Image Data: ASCII-cvs
 Export Results: ASCII-csv
 Export Picture: jpg, gif, tiff, bmp, png file formats supported
 Export Cursor Data: ASCII-cvs
 Export Row/Column summed: ASCII-cvs
 Export Image Data in Aperature
Automation Interface (.NET)Automation Interface with examples in LabVIEW, Excel and .Net VB
 Automate launch and termination of the application
 Automate start, stop, Ultracal, Auto-X and Auto Setup
 Automate the loading of application setups
 Automate control of most camera settings
 Automate a subset of the application features and controls
 Automate the capture of Binary Video Data
 Automate the acquisition of aplication results
 Automate the acquisition of aplication Images
Integrated HelpPDF Operators Manual
 Context Sensitive Help
 Context Sensitive Hints
Signal Conditioning for Enhanced AccuracySpiricon’s patented Ultracal enables more accurate beam measurement and display. Ultracal takes a multi- frame average of the baseline offset of each individual pixel to obtain a baseline accurate to approximately 1/8 of a digital count. This baseline offset is subtracted from each frame, pixel by pixel, to obtain a baseline correction accurate to 1/8 digital count. Spiricon’s Ultracal method retains numbers
 less than zero that result from noise when the baseline is subtracted. Retaining fractional and negative numbers in the processed signal can increase the beam width measurement accuracy by up to 10X over conventional baseline subtraction and clip level methods. Spiricon's Ultracal conforms to the best method described in ISO 11146-3:2004
Frame AveragingUp to 256 frames can be averaged for a signal-to-noise ratio, S/N, improvement of up to 16X (Noise is averaged up to 1/256th [8 fractional bits]). Data is processed and stored in a 32bit format.
Frame SummingUp to 256 frames can be summed to pull very weak signals out of the noise.
 Due to the precise nature of Ultracal baseline setting, (i.e., a retention of both positive and negative noise components) summing of frames can be performed without generating a large offset in the baseline.
Convolution (Adjacent Pixel Averaging)Choice of 5 convolution algorithms for spatial filtering for both display and calculations. Spatial filtering improves the visual S/N.
Beam Maker®Beam Maker is a new feature that allows the user to model both Laguerre-Gaussian and Hermite-Gaussian laser beams in various modal configurations. With these models you have verification and validation tools that allows not only OSI but also the end user to verify BeamGage’s basic beam width measurement algorithms. It can also be used to model laser beams with special input conditions such as signal-to-noise, background offset, and bits per pixel resolution. This allows the user to better understand the accuracy of measurements made under both optimum and adverse conditions. This tool provides the user with a method to validate algorithms against current ISO standards and methods. It can also be used to validate third party algorithms by making the output data available for use in third party applications.
Camera FeaturesCamera features are governed by the capabilities of the various cameras that will interfaced with these software products, and second by which of these camera features are implemente in the software. This section will describe typical camera features supported in the application.
 Black Level Control (used by Ultracal and Auto-X and Auto-setup)
 Gain Control (used by Auto-X and Auto-setup)
 Exposure Control (used by Auto-X and Auto-setup)
 User Programmable ROI
 Pixel Binning
 Pixel Sampling
 Bits per pixel setting
 External Trigger Input
 Trigger Delay
 Strobe Output
 Strobe Delay
 External Trigger Probe
 Internal Trigger Probe
Camera related features in the applicationsThese are features related to but not generally dependant upon the camera design.
 Gamma Correction
 Gain Correction
 Bad Pixel Correction
 Lens Applied Option
 Pixel scale settings
 Magnification settings
 Frame buffer settings
 Ultracal
 Enable Auto-X (auto exposure control)
 Perform an Auto-Setup
 8/10/12/14/16 bits per pixel
 Select Format or ROI
 Measure S/N ratio
Trigger, Capture and Synchronization MethodsCapture methods are features related to the application while Synchronization methods relate more to the abilities of the specific camera. NOTE: Frame capture rates are determined by many factors and are not guarenteed for any specific operating configuration.
 Trigger modes
  CW - captures continuously, see Capture Options below
  Trigger-In from laser: Trigger pulses supplied to the camera
  Strobe-Out to laser: Strobe pulses output from the camera
  Video Trigger: Frame captured and displayed only when the camera sees a signal greater than a user set level
 Capture options
  Capture options are redefined and are approached in a different manner than older products. The items listed below will allow for all of the previous methods but with more flexibility than ever before.
  Results Priority: Results priority will slow the capture rate to be in sync with the computational results and display updates.
  Frame Priority: Frame priority will slow results and display updating to insure that frames are collected and stored in the frame buffer as fast as possible. (replaces block mode)
  Stop After: Will collect a set number of frames and then stop (replaces Single-Shot mode)
  Periodic: Will collect frame at a programmed periodic rate.
  Periodic Burst: Will collect frames in a Burst at programmed periodic rates
 Post processing is still available but is done via a different mechanism and is limited to only data file sources.
Video PlaybackVideo playback, post processing and post analysis
 User customizable playback rates
 Video file quick pan/search controls
 Whole video file playback looping with sub-selection looping
 Playback Video produced by logging
 Almost all measurements can be performed on video files
System Requirements
PC computer running Windows 7 (64) and Windows 10
Laptop or Desktop
 Not all cameras run in all Microsoft OS versions, see camera section for specifics
 GHz Pentium style processor, dual core recommended
 Minimum 3-4GB RAM
 Accelerated Graphics Processor
 Hard drive space suitable to hold the amount of video data you expect to store. (50-100 GB recommended)


  • BeamGage StandardBeamGage Standard
    BeamGage Standard is our full-function software with an extensive set of ISO quantitative measurement, our patented Ultracal™ algorithm for the highest accuracy measurements in the industry.
  • BeamGage ProfessionalBeamGage Professional
    BeamGage Professional has all of the functionality that BeamGage Standard includes. BeamGage Professional supports all of our beam profiling cameras, includes window partitioning to allow analysis of multiple beams on a single camera, and includes an automation interface written in .NET to push data to your custom applications.

FAQ

How can I use BeamGage Professional with my BeamGage Standard camera system?

If your camera is licensed for Standard, you can add a higher level tier with a software upgrade that can be purchased for a fee. This includes the license code and the software DVD on a per camera basis. Instead of DVD, the BeamGage Professional software can be downloaded fromOphir site https://www.ophiropt.com/laser--measurement/software-download

BeamGage Professional allows you to run an automation interface and also allows partitioning of the array to take measurements of multiple beams. 

Close

Why does BeamGage have a Windows shield icon on the BeamGage desktop icon, or BeamGage asks me to log on as an Administrator to run the application?

In previous versions of BeamGage it was required to install and operate BeamGage with elevated privileges. The BeamGage 6.1 application core has been over hauled to eliminate the need for operating the software with elevated privileges. You still have to install BeamGage 6.1 from an Administrator level account, but now you can operate it OK with restricted user privileges.

Close

Can I use my beam profiling camera as a power meter?

A camera is not meant to be a power meter. Even though BeamGage has the ability to measure and display a power/energy reading, you first need to use a NIST calibrated power/energy meter to get a calibrated power or energy meter reading to relate it to a given beam profile that is taken simultaneously. Then you can have a relative power reading come from your BeamGage beam profiling camera system. In adition, BeamGage reading can indicate a trend of laser power at same settings. For example, if you have a laser source with known Power/Energy, you can mark that parameter in BeamGage>Computations>Power Energy tab, and see trend in case of increase or reduction in laser intensity.

If you use an Ophir USB based power/energy meter display you will be able to link this equipment into BeamGage to get a continual feedback from your Ophir equipment into BeamGage to create this connection for you. You need to keep your Ophir sensor in the beam path so it will continually update the related reading to the given beam profile.

Close

How does BeamGage produce higher resolution pointing stability than the size of one pixel in the camera?

As BeamGage collects data points to put into the Pointing Stability function it allows you to see the concentration of where the data points are located. These are fitted to a distribution and you can get fractions of data that can produce information that is beyond the precision of the camera pixel.

An example would be if we collect 10 data points that have 5 points in one location and 5 points in a location just 1 pixel away. The distribution will indicate the centroid is in between these two points at 1/2 the pixel size. This is beyond the capability of the equipment, but the distribution mathematically is correct.

Close

What is the largest beam size you can profile?

With the addition of optics, the largest laser beam you can measure is limited by the amount of reduction afforded by the optical setup.  With the use of supporting equipment such as beam reducers or CCTV lenses a spatial calibration can be performed, giving the equivalent pixel pitch with the lenses in place.  Sometimes an imaging target may be needed to make sure you are focusing the imaging optics to the correct location. 
 
In most applications the beam size is less than 10mm. When a beam gets larger, a reducing telescope can be used to bring it down to a size to fit on the array. Our largest array camera, the L11059, has an array size of 26x39mm.
Close