All lasers or optical delivery systems degrade over time. A Power and Energy meter will help verify this and quantify this over time. It's a diagnostic tool to ensure that the laser system is delivering the specified amount of energy or power. The precise measurement of energy may critical in many of the processes in which they employed.
Power Meters FAQ's
General Information
Medical, semiconductor, welding, cutting, micromachining, barcode laser mfg
The internal monitoring does not usually include the rest of the power transmission train, mirrors and fibers. Since there is usually a discrepancy between what the internal meter measures and what is actually coming out, there is often a need to measure externally as well as internally. However, many users do not realize this.
Yes, many users of aesthetic lasers may not have that awareness that what actually comes out of the laser delivery system may vary dramatically from what the internal monitors displays what is coming out and needs external monitoring.
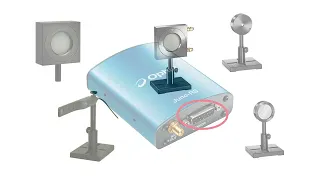
Yes you can for Ophir thermal or photodiode sensors, but then the output will not be calibrated. Ophir sells an adapter (Ophir P/N 7Z11010) that connects to the DB15 plug and has BNC output. This will make available the raw output from our thermal and photodiode sensors.
How long you fire the laser into the meter depends on you. Some manufacturers do it 100% of the time via a beam splitter. That way they have a constant feedback system to allow them to not only monitor the power output, but also to control it so the laser is stable. Other people only do it for a short time to verify the setting is producing the correct amount of power. For different applications different sensors would be needed. For continual monitoring we would recommend a sensor that is designed to have the laser on it all the time. For short time measurements, a sensor designed for short use would be more ideal. For lasers that are pulsed, we recommend firing the laser a couple of times to get an understanding of the pulse to pulse change as well as being able to monitor the average. However, some applications only want to verify the energy setting, so they only fire the laser once to see if they are ready to go. Again, the decision is up to you. Processing the information in the PLC is completely up to you. Usually this requires some form of calibration so you can take the information you are delivering to the PLC and correlate it with your operator display. I.e. Volts/Watt. How many Volts from the sensor is equal to X amount of Watts the laser just produced.
Chargers can be ordered from your local Ophir distributor. For reference: 12 VDC, 500 mA, with the center pin being negative. The center must be negative with the older sensors Nova, Laserstar and NovaII. The newer sensors have the ability internally to switch the polarity to allow the use of different polarity power supplies so the polarity does not have to be negative.
Yes, as long as it has the correct voltage output, current output, connection polarity and it is CE certified.
The easiest way for customers inside the United States to order our most common spare parts for Ophir power/energy meter equipment is to use our web site. We have a dedicated section under the Ordering tab on our web site listed below where you can order Spare Parts. If you are outside the United States, or you do not see the parts you are looking for, please contact our Sales or Service Departments and they can help you with spare parts.
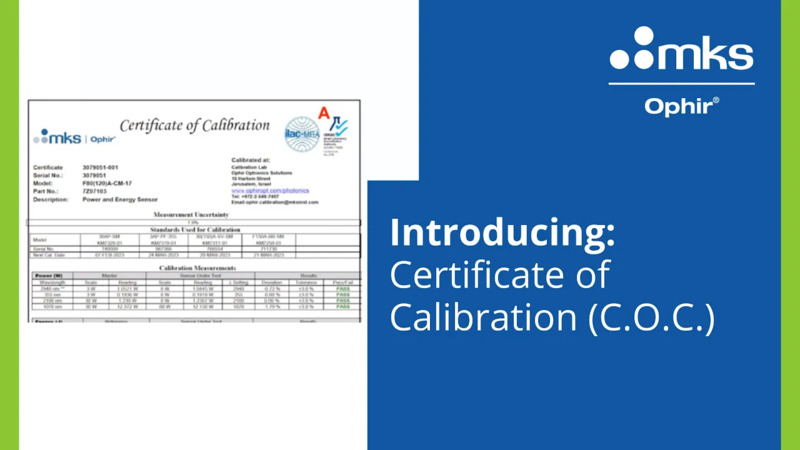
Please send an e-mail request to our Calibration department that includes the S/N of the device you are missing the Certificate of Calibration for and we would be happy to e-mail you a copy of the latest Certificate of Calibration for the device. Calibration@us.ophiropt.com
1Z part numbers are not RoHS compliant. Meaning there may have been lead used in the manufacturing of the device. To easily identify our parts that are RoHS compliant, we changed only the first character of the part number from 1 to a 7 so we could retain the remainder of the part number for easy identification by us and by customers. If you need a data sheet, try substituting a 7 instead of a 1 in the part number of the device you are looking for. If you still can't find us, please contact our Service Department who would be happy to assist you in getting the needed data sheet. We have a link below to a statement on our web site regarding RoHS compliance if you need it for your records. https://www.ophiropt.com/laser-measurement-instruments/customer-support/customer-support/rohs-compliance
Unless otherwise indicated, Ophir sensors and meters should be recalibrated within 18 months after initial purchase, and then once a year after that.
Ophir water cooled sensors measure the heat flow across the thermopile disc and therefore are quite insensitive to the water temperature or flow rate within the given specified limits. However, sudden changes in the water temperature or water flow rate can cause a disturbance to the reading until the flow rate/temperature stabilizes again. Therefore we specify in our water cooled sensors that the water temperature should not change faster than 1C/min. Likewise, sudden changes in flow rate (e.g. switching another device connected to the same water line on and off) can results in temporary disturbances in the power reading.
The spectral range stated at the beginning of the spec indicates the range of wavelengths for which the sensor can be usefully used even if the exact calibration is not specified for that range. This means that over the calibrated wavelength range, the accuracy is specified and guaranteed. Over a wider useful wavelength range, the sensor is usable but no accuracy is guaranteed. In general over this wider range, the accuracy will be within up to ±15%.
This can happen if one disconnects the meter from StarLab by pulling out the USB connection without shutting down StarLab first..
It will not happen when normally closing the StarLab application.
Laser Power/Energy Sensors
If you can’t just arrange for a feedthrough of the cable through the chamber wall, then you’ll need to have panel-mounted connectors on the inside and outside of that wall; one cable segment connects from the sensor to the connector on the inside of the wall, and another cable segment continues from there to the meter. The trick is where/how to split the cable (you can see a short video about this question here. The starting point is that the D15 connector with the sensor’s EEPROM inside must be connected to the meter, and any split will be elsewhere along the cable. From there, for power sensors the simplest solution is to cut the sensor cable between the D15 smart plug and the sensor itself. There are only 2 internal wires and a screen/shield to connect, and the panel-mounted connectors will be simpler. (If you need to do this on multiple sensors, you’ll need to be careful to keep each sensor paired with its own D15 plug, as the EEPROM in the D15 plug is where the individual sensor’s calibration data is stored.)
More generally, such as for other sensor types, the usual way to approach this would be to use a “split cable” solution, where there would be a panel-mounted D15-to-D15 feedthrough connector on the vacuum chamber panel (the 2 D15 connectors would be “dumb”, i.e. without the EEPROM inside that holds the calibration data – their purpose would be just to feed-through), and from the outer connector there would be a second segment of cable terminating in a “Smart” D15 connector that connects to the meter. Consult with Ophir if this is of interest for you.
Each Ophir sensor data sheet states its accuracy, typically something like ±3%. This refers to the absolute uncertainty of the measured value. For example, for a 2 Watt reading, the actual "true" value would be between 1.94 W to 2.06 W (with reference to NIST, to which all our calibration is traceable). To this must be added other uncertainties, if they exist. This assumes the reading is from about 5% of full scale up to full scale. It should be noted that our accuracy specification is, in general, based on a 2 sigma standard deviation.
This White Paper explains in detail exactly how we arrived at the accuracy numbers we specify, and what exactly they mean: Ophir Power/Energy Meter Calibration Procedure and Traceability/Error Analysis.
BeamTrack Power/Position/Size Sensors
Position and Size are measured along with power. Therefore, if the laser is pulsing at a rate at which average power can be measured, then position and size can be measured as well.
Yes StarLab can log beam position. The BeamTrack sensors are thermal sensors. The power measurements for all Ophir power sensors are logged at 15 times a second. When a BeamTrack sensor is connected to StarLab via a Juno, the position / size measurements are also logged 15 times a second. When a BeamTrack sensor is connected to StarLab via a Vega/ Nova II, the position / size measurements are logged once a second. This is because in the Vega / Nova II we sample these parameters slower.
Position can be measured for any beam shape. Size can be measured to specified accuracy only for Gaussian (TEM00) beams. For other laser modes, size measurement is relative only.
The Vega, Nova II, StarLite. StarBright and Juno support the BeamTrack (PPS) sensors. All other instruments can display power and single-shot energy of a BeamTrack sensor, but do not display beam position and size.
The hardware of all of these devices supports the BeamTrack sensors however, the firmware may need to be upgraded. Click here for a free download of the latest firmware from our web site
The Ophir BeamTrack series of Power/Position/Size meters may be just the thing. In addition to all the things an ordinary power/energy meter does, the BeamTrack will measure the beam position and size as well to a precision of ~0.1mm. For a gaussian beam it will give you the actual beam waist diameter and for other beams it will give a relative number that changes with beam size. See http://www.youtube.com/watch?v=U2oliO-Cz8M for a demo of the BeamTrack.
The specified response time is only for the power and not for the size or position; response time is intentionally given in the Power section of the spec.
We haven't defined a position and size measurement response time because it depends on too many different parameters. For example:
- Small changes in size or position will respond quickly, large changes are much slower.
- Going from a large spot size to a smaller one is faster than going the other way.
- Position and size can change at the same time.
- If the power also changes it is even more complicated.
So the response time for size and position cannot be meaningfully specified by a single number. Having said all that, however:
In general, unlike the power reading which is accelerated by the predictive “speedup” function, the size and position measurements can't use the speedup so they are a bit slower.
The rise time for Position and Size is typically 5x – 10x the specified power response time.
Fall times for a decrease in power density (i.e. increase in size relative to power, as above) can be longer.
The answer to this is, of course, it depends. It depends on the pulse frequency and it depends on which sensor you want to use. Thermopile detectors do not have very fast response times, so frequencies above 100Hz are effectively the same as CW to them and all BeamTrack functions will perform as expected. Below 100 Hz the response time of the detectors becomes relevant. Low power sensors generally have faster response times so they will be more susceptible to fluctuating readings when used with a pulsed laser. The position measurement function uses the same thermopile detector as the power reading. If the laser frequency is high enough for the sensor to provide a stable power reading without fluctuations then the position measurement function will perform well too. All of our BeamTrack sensors will provide reliable position measurements for pulse frequencies down to below 10 Hz. The beam size function employs a detector that has a faster response time. At low frequencies the size measurement reading will fluctuate. We don't recommend relying on the size reading for laser pulse frequencies below 100 Hz. In any event, you can always try the sensor with your laser. If the readings are stable, without significant fluctuations, then they will be reliable.
Software
All Ophir RS232-speaking instruments can communicate with a Linux machine. There is no dependence on which operating system is being used on the other side – it’s a simple command and response protocol.
Programmers wanting to use commands via RS232 to control and collect data from an Ophir instrument need to refer to Appendix A in the “StarCom” User Manual - ‘Guide to Programmers’ section. This can be downloaded from the “Download – Manuals” section of our website, https://www.ophiropt.com/laser-measurement-instruments/laser-power-energy-meters/services/manuals
We have recently developed a package that enables USB communication with our meters from a Linux machine. It is now in beta-testing and has been released to several selected users. If you'd like to get this package, please contact us.
Yes, Ophir provides example projects of COM Object clients in C#, C++, LabVIEW, Matlab, and Python. These are found in the Automation Examples subdirectory of our StarLab PC Application installation directory.
System Integrators will need the following components:
- OphirLMMeasurement COM Object.pdf lists and describes the methods and events available for configuring, controlling and uploading measurements from Ophir devices.
- OphirLMMeasurement.dll. COM object component developed and supplied by Ophir for communication with the Juno, Nova-II, Pulsar, Vega, StarBright and StarLite devices. The COM object is registered when the application is installed.
- OphirLMMeasurement COM Object.pdf describes how to register it on another PC where the Ophir application has not been installed.
- Standard micro-B USB cable (P/N 7E01279) for use with the StarBright device (included).
- Ophir provides example projects of COM Object clients in VC#, VB.NET and LabVIEW. These are found in the Automation Examples subdirectory of our StarLab PC Application.
- For direct control of the device, refer to User Commands.
In order to get started, install the latest version of StarLab on your PC. The COM Object registration is included in the StarLab installation process.
- Download LaserStar Dual Channel VIs (744 KB) and run it.
- This will run the WinZip Self-Extractor and default to unzip the Dual Channel LaserStar VI's to "C:/Program Files/National Instruments/LabVIEW 6.1/instr.lib". To select a different target folder, press the "Browse" button.
- Press the "Unzip" button to complete the self-extraction process.
- Press "Close" to close the session.
Download LabVIEW library Ophir Instrument OphInstr.llb(324 KB) and copy to your target directory.
- Download Nova VIs (468 KB) and run it.
- This will run the WinZip Self-Extractor and default to unzip the Nova VI's to "C:/Program Files/National Instruments/LabVIEW 6.1/instr.lib". To select a different target folder, press the "Browse" button.
- Press the "Unzip" button to complete the self-extraction process.
- Press "Close" to close the session.
To install StarCom on your PC please do the following:
- Please uninstall previous version before installation.
- Download StarCom V3.20 (3.75 MB) - [32-bit].
- Run the file and follow the on-screen instructions.
- After installation is completed, you can Run the StarCom Application from your computer Desktop.
Note: StarCom must be installed with Administrator privileges
Integrating Sphere
An unused port should be closed, to prevent unwanted light from entering the sphere. Closing it with a diffuse white port plug, however, adds the surface area of that plug to the (diffuse white) effective area of the sphere that is doing the “integrating”. For a calibrated integrating sphere sensor, this change in the behavior of the sphere changes its calibration, and results in incorrect readings. In such applications, a black “Port Cover” should be used.
In general, as the divergence angle of the beam entering the integrating sphere increases - and as its diameter increases – the assumptions on which we base the sphere’s performance (infinite reflections inside the sphere walls, perfectly uniform distribution of light inside the sphere, etc.) become less correct. We therefore specify the maximum beam divergence (such as +\- 40 deg), and we also state the maximum possible change in reading caused by change in beam size. For the IS6 for example, we state in the data sheet that the maximum additional uncertainty due to beam size is only +/- 1% for beam divergence < 30 degrees, and +/- 3% for beam divergence > 30 degrees.
To put this in some practical terms: If you measure the power using a beam that is not much bigger than a few mm x a few mm, that has a relatively small divergence angle, and is centered on the sphere’s input port aperture, you can safely ignore this additional uncertainty.
There is a simple to use selection guide.
Here is a trick that would make this possible:
The beam should be aimed so that it is incident close to the detector port (but not hitting the baffle) – as shown in this drawing:
This way the "first bounce" will be directed to the opposite side of the sphere, ensuring that the detector will in fact see only light from the "second bounce" and onward, i.e. light that has been uniformly distributed around the inner sphere surface (normally, light from the "first bounce" of a collimated beam is not yet uniformly distributed and we don’t want the detector to see it – that is the main idea behind the different C and D configurations. This trick gets around that).
Choosing a Sensor
The biggest issue is picking out the appropriate sensor that will measure the laser light (most will measure other types of broadband light as well). Since it is not trivial to find the best sensor for a given application, we recommend using our Sensor Finder available on our website that automatically calculates the best sensor for the measurement conditions you input. However, let us list below the main criteria:
§ First of all, do you want to measure average power or pulse energy? If power, then choose a thermal or photodiode sensor. If energy, then if the repetition rate is less than one pulse every 5s, then you can use a thermal or pyroelectric sensor. If faster than that, then a pyroelectric.
§ After you have chosen the type of sensor, then look at the dynamic range and choose a sensor that will be able to measure the highest and lowest power/energy you want to measure.
§ Check that the sensor covers the wavelength region you want to measure.
§ Check that the aperture of the sensor is large enough for the beam size.
§ Now check the damage threshold. One needs to accurately know how much power or energy density one has in order to select a sensor that will not be damaged. To do that one needs to know the beam spot size, and what the energy distribution is, since for example a Gaussian beam has much higher density in the peak of the beam than a flat top or other modal beam. If the laser is pulsed, one also has to know the pulse length in time as most sensors have a different damage threshold value based on peak power; a shorter pulse with the same energy per pulse will give a much high peak power and will more readily damage the sensor. If one cannot seem to find a sensor that will not damage, then one needs to look attenuation options including beam splitters, diffusers, ND filters and possibly measuring just the leakage through a mirror.
In the above analysis there are some trade-offs.
§ Dynamic range that one needs to measure. Typically one can get roughly 3 ½ decades of range from a single sensor. ND filters and/ or other attenuation options can extend that by any number of decades. Of course with each attenuation option the uncertainty of the measurement increase, so the trade-off here would be dynamic range with a single sensor and extending with attenuators but having to sacrifice uncertainty, therefore accuracy. One may find that it may be better to have 2 sensors, one more sensitive and one able to measure higher power or energy.
§ Multiple lasers. Many end-users try to measure as many lasers as they can with as few sensors as they can in order to reduce their cost. To do this there may be some trade-offs. Maybe one won't be able to cover their full dynamic range of each laser measurement, or they have to sacrifice accuracy to cover their full range. In some cases they'll just have to get more sensors to cover all their lasers. The trade-off here is cost.
§ . Physical size of the sensors. Most end-users usually want the smallest physical size sensor possible, or maybe a large aperture with large sensing area, but the housing small. There may be some trade-offs there. If it's high power, there may an issue in cooling the sensor; either through convection, conduction, forced-air, or water. Each comes with its own trade-off. If attenuators are used, the space they require may be an issue.
A more detailed guide to selecting the optimal sensor for a given application can be found in our online Tutorials at https://www.ophiropt.com/laser-measurement-instruments/laser-power-energy-meters/tutorial/properly-select and https://www.ophiropt.com/laser-measurement-instruments/laser-power-energy-meters/tutorial/select-sensors. And again, use the sensor finder to point you in the right direction.
One has to be careful about this since many vendors quote the damage threshold at a power much lower than the maximum power of the particular sensor being advertized. As an extreme case, a meter that can measure up to 1000W, may be quoted a certain damage threshold and in a footnote it may be noted that this damage threshold is for 10W. The damage threshold can go down dramatically with power and the damage threshold at 1000W may be 4 or 5 times less than at very low powers. Ophir always quotes damage threshold for a particular sensor at the highest power the sensor can measure.
Very often, a laser spec gives a range of values for various parameters – for example, pulse width might be specified as "Up to 30 msec", or pulse frequency might be given as ""10 – 200 Hz". If we enter the highest numbers for all the parameters into the Sensor Finder – in this example, 30msec pulse width and 200Hz frequency – then clearly the math may not line up, since these 2 values do not match each other. In such a case, it is important to check what the actual "worst case combination" (or perhaps combinations) of conditions of measurement will be.
We do have a recommended substitute list for discontinued sensors available at; https://www.ophiropt.com/laser--measurement/replaced-pn
General Specifications
If the power is P and the diameter of the beam is D then the power density is P /(.785 * D2) . If it is a pulsed laser and the energy is E, the repetition rate is R and the diameter is D then the power density is E*R/(.785 * D2), The energy density is E/(.785 * D2). The sensor finder will automatically calculate the power and energy density.
Generally, our sensors are calibrated (traceable to NIST) to within ±3% accuracy 2 sigma which means that 95% of the sensors are accurate within ±3%. However, if your application requires very high accuracy, we also offer something called “double calibration” which can bring the error down to ±2%.
The accuracy specification is ±3% of any given reading. This is the accuracy of the calibration under the conditions of calibration. To this must be added other uncertainties if they exist. For more details see: https://www.ophiropt.com/laser-measurement-instruments/laser-power-energy-meters/tutorial/calibration-procedure
It varies from sensor to sensor. In general, the uniformity is better than +/-2% over the central 50% of the area and for many sensors considerably better than this. For more information see our tutorial at https://www.ophiropt.com/laser-measurement-instruments/laser-power-energy-meters/tutorial/calibration-procedure
It is defined as that level where reading changes by >1%. Cosmetic damage is not considered damage if the reading does not change.
The damage threshold refers to the power or energy density at any point in the beam. So if we have a gausssian beam, the damage threshold refers to the power in the center of the beam. For a top hat beam, the damage threshold will be at any point in the beam. The sensor finder allows you to choose between a top hat and gausssian beam when calculating the damage threshold.
Some beams are not smoothly top hat or Gaussian and may have hot spots. Furthermore the damage threshold is not always an exact level. So the user is recommended to choose a sensor that does not exceed more than 50% of the specified damage threshold.
This depends on whether you are using a thermal sensor or a photodiode sensor. With our most sensitive thermal sensor, model RM9, one can measure down to about 500nW. With our photodiode sensor heads we have a several types, silicon, InGaAs and Germanium. Each has a spec on minimum power, which can be as low as 10pW
In order to get a meaningful power reading on a power meter, the signal being measured must be considerably larger than the noise. In fact there is a measure of this, the signal to noise ratio or SNR that is often used. If the SNR is 1 then the noise is the same size as the signal and this signal is barely distinguishable. There are some that will quote this number as the minimum measurable, but most agree that the signal must be considerably larger than the noise to be measurable. One criterion used by many is 10:1 SNR as the minimum useable measurement. However, when the noise referred to is 1 standard deviation or 1 Sigma, then a certain amount of the time the noise is 2 times this or even 3 times so 10:1 SNR 1 Sigma is still not a very precise measurement. For these above reasons, Ophir has taken a particularly strict definition of minimum measurable power and that is 20 times the 3 Sigma noise value. This is 6 times as strict as the usual 10:1 1 Sigma value often given or implied. The Ophir value means that most of the time, the noise does not exceed more than 2% of the signal.
For pyroelectric energy sensor heads there is no limit on how short the pulse is, as they are integrating devices. As long as one does not exceed the damage threshold expressed in terms of energy density then they will accurately integrate pulses as short as femtoseconds. With thermopile sensors they similarly can be used as integrating devices to measure energy, although one can only measure single pulses every few seconds as they have a much slower response time than pyroelectrics. With repetitive short pulses one can measure the average power with a thermopile with no restriction on how short the pulses are, as long as the maximum energy density is not exceeded. The spec for damage threshold varies on type of absorbing surface of each sensor head type. Consult our damage threshold charts or use the Sensor Finder for detailed information.
The Ophir specification on accuracy is in general 2 sigma standard deviation. This means, for instance, that if we list the accuracy as +/-3%, this means that 95% of the sensors will be within this accuracy and 99% will be within +/-4%. For further information on accuracy see https://www.ophiropt.com/laser-measurement-instruments/laser-power-energy-meters/tutorial/calibration-procedure and https://www.ophiropt.com/laser--measurement/knowledge-center?search=calibration&=SEARCH
Yes, for instance with a 100W sensor, the accuracy at 10W would be ±0.3W and at 100W it would be ±3W.
It depends on the sensor and on the range the sensor is set to for the measurement. The easiest way to figure out the resolution is to look at the display. For example, a 30 W sensor has three places after the decimal in the 5 W range and two in the 30 W range. So the resolution is 1 mW for the 5 W range and 10 mW in the 30 W range.
We have had customers in the past who measured electron beams with our thermal sensors (with the BB absorber), and it seems the absorber absorbs close to 100% of the radiation. So it can be done. Presumably this is in a vacuum, so that has to be taken into consideration.
Each sensor from Ophir includes a performance specification datasheet but not a user manual. This datasheet lists operational parameters for the sensor, including items such as spectral range, power range, aperture size, accuracy specification, etc. Copies of these datasheets for current sensors are available on the website by clicking on the “Specifications” tab of the sensor's product page.
As for the user manual, a hard copy of the user manual is included with every meter sold. The manual also has a section explaining the operation of the various types of sensors; thermopile, photodiode, and pyroelectric. Copies of the meter user manuals are available on the web site at: https://www.ophiropt.com/laser-measurement-instruments/laser-power-energy-meters/services/manuals.
If for any reason you are not able to find the particular information needed or are not able to retrieve the manuals or information from the website, just send us an email request to service@us.ophiropt.com and we’ll get the information for you.
Calibration
The Power Accuracy of +/-3% refers to the absolute uncertainty of the measured value. For example, for a 2 Watt reading, the actual "true" value would be between 1.94 W to 2.06 W (with reference to NIST, to which all our calibration is traceable). This assumes the reading is from about 5% of full scale up to full scale. It should be noted that our accuracy specification is in general based on 2 sigma standard deviation.
Repeatability of the measurement (assuming the laser itself is perfectly stable) is limited in the best case by the power noise level of the sensor, and is typically better than +/- 1% depending on the thermal stability of the environment. Stability at higher powers from the middle to the top of the range of the sensor head is usually better than the low end. This is due to small temperature variations having less of an effect as they are proportionally a lower percentage of the total power. For more information, refer to our Web tutorial at: https://www.ophiropt.com/laser-measurement-instruments/laser-power-energy-meters/tutorial/calibration-procedure
With normal usage we recommend calibrating every 12 months. To accommodate shelf time and shipping time new manufactured product comes with a calibration sticker that shows a recalibration period of 18 months from manufacturing. However this does not negate the recommended 12 month recalibration interval should you receive the product with more than 12 months remaining on the new manufactured calibration sticker.
The standard turn-around time from receipt to issuing quotation for power meter calibration is less than 5 days. We do offer additional expedite service for 3 days and super expedite for within 24 hours.
If the calibrated wavelength is W1 and I want to measure at wavelength W2 then I look at the relative sensitivities on the curve at W1 and W2 and calculate as follows: Sensitivity at W1: s1 Sensitivity at W2: s2 When instrument is set to W1 and I measure W2, then multiply reading at W2 by s1/s2 to get correct reading at W2.
All absorbers used in power/energy measurement are not entirely flat spectrally, that is, they vary in absorption with wavelength. For this reason, Ophir measuring sensors are usually calibrated at more than one wavelength. If the absorption changes only slightly with wavelength, then we define wavelength regions such as <800nm, >800nm and give a calibration within these regions. In that case, the error in measurement between the wavelength the device was calibrated for and the measurement wavelength is assumed to be within the primary wavelength calibration error.
An explanation of how we can accurately calibrate at a fraction of the maximum power is given in our catalog introduction and on our website. In addition, in order to be sure of the calibration at higher powers, we have to know if the linearity of our sensors is within specification. For this purpose we have a 1500W sensor calibrated at various powers at a standards lab. Using a beam splitter and a 15,000 Watt laser we periodically check the linearity or our highest power sensors against this secondary standard.
Over time the equipment can become damaged, dirty, or drift and it is recommended to have the equipment recalibrated every year to make sure the equipment is measuring accurately within its allowable tolerances.
We now have a portal on our web site for calibrations. You can request a username and password by e-mailing us at calibration@us.ophiropt.com. After that, you can log in and check the status of your RMA at any time.
Below is a link to this portal. It is currently available only for US customers.
https://calibration.us.ophiropt.com
Ophir offers a "special calibration" service so the customer can be provided with higher calibration accuracy than the standard catalog accuracy. To learn more
Customers often measure the same laser with 2 different Ophir sensors, both of which are specified to be within calibration. Let’s say that both of the sensors are specified to have a calibration uncertainty of ±3%. Do I expect the difference in reading between them to be less than 3%? On the first thought, this is what one might expect. However this is not necessarily so.
First of all, when we specify a calibration accuracy of ±3%, we are talking about a 2 sigma uncertainty, i.e. the readings of various sensors will be within a bell curve with 95% of all sensors reading within 3% of absolute correct calibration and 5% reading outside this accuracy. Thus there is a small chance that the meter will not be reading within 3% of absolute accuracy.
A more important reason is that the two sensors’ calibration error may be in two different directions and thus show a larger discrepancy between them than 3%. Say one sensor has been calibrated and reads 2.5% above absolute calibration and the other 2.5% lower than absolute calibration. Both of the sensors are within the specified ±3% absolute calibration but they will still read 5% differently from each other.
If we do statistical analysis, the analysis will show that there is in fact a probability of >16% that two correctly calibrated sensors will differ in reading from each other by more than 3% and a probability of over 6% that the sensors will differ in reading between each other by more than 4%.
Using Your Sensor
First, clean the absorber surface with a tissue, using Umicore #2 Substrate Cleaner, acetone or methanol. Then dry the surface with another tissue. Please note that a few absorbers (Pyro-BB, 10K-W, 15K-W, 16K-W and 30K-W) cannot be cleaned with this method. Instead, simply blow off the dust with clean air or nitrogen. Don't touch these absorbers. Also, HE sensors (such as the 30(150)A-HE-17) should not be cleaned with acetone.
Note: These suggestions are made without guarantee. The cleaning process may result in scratching or staining of the surface in some cases and may also change the calibration.
There is a rule of thumb about this for sensors made of aluminum. You can use the sensor without cooling for about 1 minute/watt/cm3 of sensor. So if a sensor has a volume of 300cm3 and you put in 100W, you can use it for 3 minutes. The sensor finder program https://www.ophiropt.com/laser-measurement-instruments/laser-power-energ... has an option for intermittent use of an Ophir sensor and will automatically calculate this for you.
No. The Broadband coating of the PE and 3A sensors is delicate and should not be touched. You can use clean low-pressure air to blow debris off as necessary.
The largest problem we see from equipment that is not working at top performance is contamination on the sensor. Dust or other contamination on the sensor surface can greatly impact the readings the sensor provides. When dust or other contaminations are on the sensor when it is illuminated by laser power/energy it can become "burned onto" the sensor. Simply blowing this contamination off before using the sensor can greatly reduce these problems and make the equipment perform at top performance for a longer period of time. Using canned air or dry nitrogen from a distance of 6 inches or more to lightly blow off the sensors can remove most of the contamination. Turn the sensor upside down so the surface the laser hits on is pointing to the floor. Start a light flow of air while pointed away from the sensor and lightly sweep it across the sensor without increasing the flow. This will lift most of the dust or other contamination from the sensor surface and gravity will continue to pull it to the floor.
Ophir meters and sensors are calibrated independently. Each meter has the same sensitivity as the other within about 2 tenths of a percent. Each sensor is calibrated independently of a particular meter with its calibration information contained in the DB15 plug. When the sensor is connected to the meter, the meter reads and interprets this information. Since the accuracy of our sensors is typically +/-3%, the extra 0.2% error that could come from plugging into a different meter is negligible and therefore it does not matter which calibrated meter we use with a particular calibrated sensor.
This depends on what information you are trying to discover. If your laser is CW, then you will measure the output in Watts (power). To do this you can use a thermopile sensor (for medium and high power) or photodiode sensor (for low power).
If you have a pulsed source you can measure the average power using a thermopile sensor. If you would like to measure energy in individual pulses, then a pyroelectric sensor is required. We have pyroelectric sensors that can measure the energy in individual pulses up to 25 kHz pulse repetition rate.
The basic physics of light tells us that – unless we are dealing with some exotic effect of absorption by the air, such as with extreme UV – a parallel beam contains the same amount of power at long distance as at short distance.
Assuming that the beam really is in fact parallel…The sensor may be measuring something other than just the optical power in the beam. At a close distance, it might be measuring heat coming out of the laser diode as well as light. These laser diodes can produce significant heat; this would explain the decrease in measured power with increasing distance. You can check this by putting a window between the laser diode and the sensor to block the heat (briefly) and seeing if the same effect happens (of course the window will introduce some reflective losses, but this is just to confirm what is happening). It might be a good idea to put the window at a slight angle, so any reflected power won’t go back into the laser diode where it could cause damage.
To connect a fiber to an Ophir sensor, why do I need 2 items – an “Adapter” and a “Mounting Bracket”
The idea is used with most (though not all) sensors; the fiber optic connectors are standard (such as FC, SMA, etc.), but the sensors are all different in their mechanics, so we use the standard FO connectors but provide in addition mounting brackets for connecting the FO connectors to the various sensors.
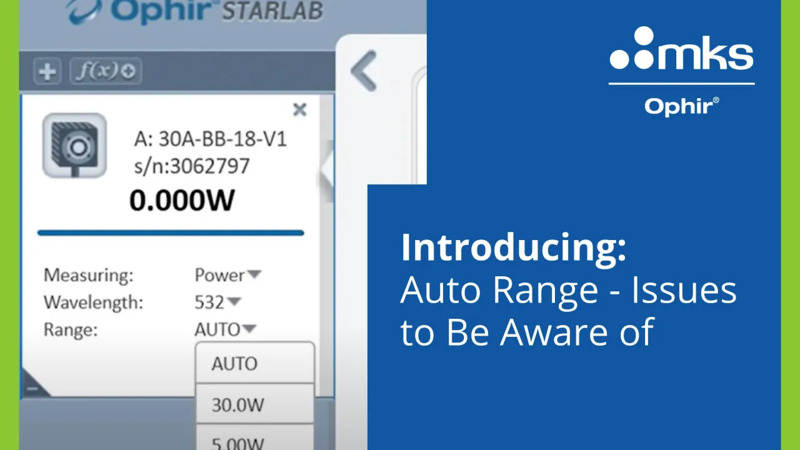
A gap of a few seconds in the measurement stream is often caused by having the power range set to Auto.
When in Auto Range, no measurements are streamed in the brief period the meter needs to search for a suitable power range when the power level moves out of the present range.
To avoid this, try setting a manual power range.
"Repeatability" is the degree to which repeated measurements of a beam's power (assuming the power stays perfectly stable) will give the same results. This is often referred to as "Precision" (as opposed to "Accuracy").
Repeatability of power measurement (assuming the laser power itself is perfectly stable, and also its position, angle, etc.) is limited in the best case– and on the lowest range or scale - by the power noise level of the sensor. (In real life we don’t always achieve the "best case", but still the repeatability is typically better than +/- 1%.) At higher ranges we are limited by simple digitization. For example, let's say we are using a PD300 sensor on its 30mW range; this is displayed as 30.00 mW. The lowest digit is 0.01 mW (i.e. 10 uW); that is in fact the best repeatability we can get on this range.
Other
All Ophir power meters, including photodiode power meters, have an air gap between the fiber tip and the sensor. Therefore they measure the power emitted by the fiber into the air and do not take into account any reflection losses there are in the fiber. Therefore, if in actual use, the fiber will be coupled with no loss to another element, then the losses should be added to the reading. These losses are usually about 4%. Thus if the reading on the Ophir meter is say 100mW, then in lossless use, the real power will be 104mW.
Yes. We now offer a switching universal power adapter/charger for the Ophir displays. It is part number 7E05029.
The spec was designed around the way such lasers are typically used. Since these lasers are normally used with focusing optics, the spec of the 120K-W does not give a maximum power density; rather, it defines the assumed focusing-lens focal length and position such that the beam will end up having a 100mm diameter at the cone, and defines the assumption of a near Gaussian beam under those conditions so we can define a baseline number. This is defined briefly in the spec, and in a bit more detail in the User Note that comes with the sensor.
Choosing a Sensor
Yes, we have the ability to rapid prototype standard OEM sensors to help with custom applications where an off the shelf sensor does not fill the requirement.
Surface Absorbers are spectrally broadband and spectrally flat due to their absorbing surface. With Surface Absorbers, the photons are converted to heat in the front layer of the absorbing surface. The P and PF versions of these sensors have a surface that absorbs within the volume of the coating. This provides superior damage resistance for high energy Q-switched type lasers, but has a lower damage threshold for CW lasers. This type of sensor is referred to as a Volume Absorber; the laser energy is absorbed in the volume of the material below the front surface. For a detailed discussion of thermal surface and volume absorbing sensors and absorbers for high power lasers, click here.
It is not recommended to choose a sensor if it is very close to the damage threshold if there is an alternative, since laser damage is not an exact figure and depends on many things. Use the Sensor Finder to find the best match where you are preferably below 50% of the damage threshold.
The new LP2 coating has a number of advantages vs the previous LP1 coating:
Absorber | LP1 | LP2 |
Damage Threshold at 1kW | 6kW/cm² | 10kW/cm² |
Damage Threshold at 3kW | 2.5kW/cm² | 5kW/cm² |
Damage Threshold at 5kW | 2kW/cm² | 2.5kW/cm² |
Pulsed damage threshold for 10ms pulses | 160J/cm² | 400J/cm² |
Spectral Absorption | See graphs below | |
Angle dependence | See graphs below |
The spectral range stated at the beginning of the spec indicates the range of wavelengths for which the sensor can be usefully used even if the exact calibration is not specified for that range. This means that over the calibrated wavelength range, the accuracy is specified and guaranteed. Over a wider useful wavelength range, the sensor is usable but no accuracy is guaranteed. In general over this wider range, the accuracy will be within up to ±15%.
Every case is unique, of course, and the reason for the Service Team to decide to replace the disc in one case might not be the same as their reason for so deciding in another case.
In general, though, what it comes down to is that if a given disc has a level of damage (or contamination that cannot be cleaned) such that the sensor will no longer be able to reliably measure with the specified accuracy, that would be a reason to replace the disc.
It should be noted that not every “marking” on a disc caused by laser exposure is necessarily “damage”. Sometimes it might be merely cosmetic. We generally define “damage” as a marking that changes the reading by 1% or more. If a given beam incident ON the marking reads more than 1% differently than the same beam NEXT TO the marking, then we consider that marking as damage.
In some cases, if there is a damage marking but it is small, perhaps near the outer edge of the aperture of the sensor where most of the time the beam will not actually be incident on it, a very experienced customer (perhaps an R&D physics team for example) might simply tell us to leave it as is, without repairing it, and they understand that they should avoid measuring on that one spot. For a sensor used in a Production environment, on the other hand, that would of course not be an option.
Again, every case is different, but hopefully the general idea is clear.
At the end of the day, we have to make sure we are providing our customers with a measurement instrument that will measure with the very highest possible accuracy.
Damage
We publish a nominal damage threshold for most of our thermal BB sensors as 20KW/cm2. Other manufacturers may quote higher numbers than this. In actuality, in one to one tests against competitors, our sensors show a higher damage threshold but the actual damage threshold depends on the total power as well as the power density. For very low powers such as 30W, the damage threshold can be as high as 50KW/cm2 and at high powers such as 5KW, it drops to 3KW/cm2. The Ophir sensor finder program takes account of these variations in its calculations.
The damage threshold curve in the sensors catalog only goes down to 1ns but the energy damage threshold is similar for shorter pulses. You can use ½ of the ns value for fs pulses i.e. the absorber damages twice as easily.
Corrosion is caused by interactions between the metallic components of the sensor and the cooling water, which may contain a variety of dissolved ions. Many factors affect the risk of corrosion forming, but the most important are the pH and the mixture of ions in the water. For this reason, we recommend using neutral deionized water in a closed circulating system (pH between 6 and 8). Please note that deionized water is usually slightly acidic (pH 5.65) due to absorption of CO2 from the atmosphere. The cooling water can be neutralized by adding 5 ml of a 10 mM solution of NaOH for each liter of water in the cooling system.
To prevent corrosion it is also crucial to not allow standing water to evaporate inside the sensor when it is not in use. When disconnecting a sensor from the cooling system, the water channel should be cleared by blowing compressed air through it.
The commercial additive Optishield Plus is also recommended for systems such as ours that have copper and aluminum in them. It has the additional benefit of having biocides to prevent buildup of organic contamination.
For those customers still experiencing problems with corrosion, we recommend the new thermal sensor 1000WP-BB-34 which has a special design in which all materials that come into contact with the cooling water are either copper or nonmetallic.
The damage threshold of thermal sensors does depend on the power level and not only the power density because the sensor disc itself gets hotter at high powers. For instance, the damage threshold of the Ophir broadband coating may be 50KW/cm2 at 10 Watts but only 10KW/cm2 at 300W. The Ophir specifications for damage threshold are always given for the highest power of use of a particular sensor, something which is not done by most other manufacturers. This should be taken into account when comparing specifications. The Sensor Finder takes the power level into consideration when calculating damage threshold.
Watch the 'FAQ: Does damage threshold depend on power level?' video
After the Helios reaches the maximum temperature of 60° C (approx. 40 kJ of accumulated energy), it should take about 10 20 minutes for it to cool back down to room temperature. Therfore, use the temperature sensor as the indication of how many pulses can be measured
Whether RS232 or Profinet is used, there is a command to query the current temperature. The customer is responsible for integrating this into the measurement script and coordinating with the laser control to make sure the laser is not allowed to be measured when the temperature is over the limit. If using the PC application, one should select: Options > Log Temperature Enable. This will show the current temperature (and log it). If the temperature goes over the limit, it will turn red.
An example of this is the 10K-W, which uses a reflective cone to spread the beam before it reaches the absorber. Because of the way the 10K-W is built, a small beam in the center is spread out more than a large beam. A 10mm beam, for example, is spread out to about 5 x140mm = 7cm² a reduction in power density of 9:1 . A 45mm beam is spread out to about 22.5 x 140mm = 31cm². The power density of the 10mm beam is reduced 9 times, but the power density of the 45mm beam only goes down by about 2 times. This does not apply to sensors that don’t have a cone reflector.
For the Ariel, we do not specify the “damage threshold” as such, and instead we give the table of recommended beam size and exposure time (near the bottom of the specifications page). This is the best way to define the operating parameters since the damage threshold is dependent on the exposure time for these types of measurements (where we are measuring powers that are much higher than what the sensor can measure in CW mode). So, the best way to avoid damage is to follow the specified guidelines for exposure times and beam sizes.
Calibration
The 3A-P actually absorbs about 85% at 10.6µm and therefore it can be used to measure weak CO2 lasers. Note the low power damage threshold, however, of 50W/cm2.
The RM9 is only sensitive to signals chopped at 18 Hz, so placing the chopper as close to the laser source as possible will minimize stray light entering the chopper and being read as part of the signal.
The noise specification is based on a 10 second moving average. Set the power meter to average the measurements for optimal performance.
It is also recommended to zero the sensor before use. This is done by disconnecting the BNC cable between the RM9 sensor and the chopper or turning off the chopper. Then follow the regular instructions for zeroing that can found in your power meter or PC interface manual.
The absorber is calibrated at 532nm, covering the visible and UV region. At 355nm it reads less than 0.5% higher that at 532nm and at 266nm, it reads 1-2% higher.
UV: 193 - 350nm, VIS: 350 - 850nm, NIR: 850 - 3000nm, CO2: 10.6um. Newer sensors have the regions explicitly where the laser settings are: <.8µ, .8-6 and 10.6
It is flat for <750nm and for >900nm but can vary +/-2-3% between those regions. Since it can vary in either direction, this information cannot be put in the spectral graph.
The answer to this question is two-fold. First of all the recalibration process accomplishes the recalibration of the sensor and returns it to "as-new" working condition. If there is surface damage on the sensor disc that creates areas of non-uniformity exceeding the uniformity across-the-surface specification, then the disc needs to be replaced, even though the accuracy performance of the sensor is not out-of-tolerance. Secondly, many applications require that sensors be found in-tolerance during the calibration process, or else deviation explanations are required and/or costly recalls may need to be implemented. The calibration process is intended to help maintain the sensors within tolerance if at all possible.
The accuracy is basically +/-5%, but it is complicated and depends on several factors including energy level and range; it therefore cannot be properly specified by a single number for all cases.
Yes. Thermal sensors are calibrated at 532nm, 1064nm and 10.6µm. If (for example) only 1064nm, the fundamental YAG laser wavelength is used, then the other two laser wavelengths can be disabled and we will only recalibrate at 1064nm. This eliminates the potential for out-of-tolerance failures at the unused laser wavelength selections. If you put this request in the “Special Notes” section of the RMA request checklist form, we will then know to provide this option.
Why wasn’t the firmware upgraded to the latest version when the meter was sent in for recalibration?
Our recalibration process is to not automatically upgrade the firmware in meters when they are sent in for recalibration, unless specifically requested to upgrade it. The reason for this is that we support many companies, such as medical companies, that have equipment validation processes that don’t allow changing the firmware version from the currently validated version. If you do want the latest firmware version installed, we will do that at no additional charge (for meters which are upgraded electronically) if it is specifically requested on the RMA request checklist form. For older meters (such as the Nova) that are upgraded through changing the EEPROM, a nominal fee is added, if firmware upgrade is requested. Note; upgrading the firmware does not affect the calibration.
Radiometer
Typical choppers have the same type of surface on both faces: either metallic, low emissivity or black, high emissivity.
When blocking the laser beam, metallic surfaces will reflect or scatter a significant portion of the laser power which may result in stray reflections reaching the sensor.
Black surfaces solve this issue, but if the chopper is positioned close to the RM9 or RM9-THz sensor, they will pick up a thermal signal from the chopper blades.
Stray reflections and thermal signal from the blades can impair measurement accuracy.
Our chopper enjoys the best of both worlds. It has a black surface that should face the laser beam and a low emissivity surface that should face the sensor.
The SH-to-BNC adapter will not work with the RM9 series. The RM9 needs software control from the host meter to set up its scales and settings; it is not a simple voltage or current source like a regular Thermal or Photodiode sensor. It has its own PCB and it needs power from the host meter.
Other Specs
In general, the dynamic range over a given range, i.e. the ratio of maximum useable power to minimum useable power of Ophir thermal OEM sensors is 40:1. If greater dynamic range is desired, Ophir OEM RS232 sensors are available with several selectable ranges.
Yes. Please reference the chart below:
Minimum Flow Rates for Water-Cooled Sensors
Sensor | Recommended flow rate at full power1 | Minimum flow rate at full power1 | Absolute minimum flow rate | pressure drop across sensor (at maximum flow rate) | pressure drop across 8 meter of tubing (at maximum flow rate) | ||
liters/min) | (liters/min) | (liters/min) | Bar | MPa | Bar | MPa | |
L250W | 3 | 3 | 3 | 0.3 | 0.03 | ||
L300W | 3 | 3 | 3 | 0.3 | 0.03 | ||
1000W | 6 | 3 | 3 | 0.3 | 0.03 | 0.5 | 0.05 |
L1500W | 6 | 3.5 | 3 | 0.3 | 0.03 | 0.5 | 0.05 |
L2000W | 6 | 3.5 | 3 | 0.6 | 0.06 | 0.5 | 0.05 |
5000W | 8 | 5 | 3 | 0.6 | 0.06 | 0.5 | 0.05 |
6K-W-200x200 | 6 | 6 | 5 | 0.5 | 0.05 | 0.3 | 0.03 |
10K-W | 8 | 8 | 3 | 1 | 0.1 | 0.5 | 0.05 |
15K-W | 12 | 12 | 3 | 2 | 0.2 | 1 | 0.1 |
16K-W | 12 | 12 | 3 | 1 | 0.1 | 0.8 | 0.08 |
30K-W | 25 | 25 | 6 | 2 | 0.2 | 3 | 0.3 |
120K-W | 60 | 60 | 30 | 4 | 0.4 | 3.5 | 0.035 |
You can find a lot more information about the correct use of water-cooled sensors in the article "How to use water cooled Ophir sensors", here.
Water cooled sensors will hardly be affected by ambient temperature since the sensor temperature is determined by the water temperature.
Ophir convection and fan cooled sensors are designed to operate in an ambient environment of 25degC up to the maximum rated power continuously.
When operating at its maximum rated power, the sensor’s body should typically not exceed about 80degC in temperature.
Note: If the room temperature is higher than 25degC, then the maximum power (at which the sensor can be safely operated) should be derated accordingly from the specified maximum (since dissipation of the heat from inside the sensor to the surrounding air will be more difficult). For example, if the room temperature is 35degC, then the maximum power limit should be (80-35)/(80-25) = 82% of maximum rated power as given in the sensor’s spec.
Pin fins can cool the same laser power to a lower temperature or take higher power in the same size sensor. Take the FL250A sensor, for example, used with a 250 W laser: The old version would reach 74 °C at maximum power, while the new only reaches 55 °C.
The maximum temperature rise allowed is 10-15degC . We base our water flow data on this.
You can find a lot more information about the correct use of water-cooled sensors in the article "How to use water cooled Ophir sensors", here.
The energy threshold (at which a thermal head will be triggered to begin a single pulse energy measurement) has 3 levels: HIGH - ~3% of full scale; MED - ~1% of full scale and LOW - ~0.3% of full scale. Sometimes the lowest energy range and LOW level give false triggering or missing pulses. In any case the standard deviation will be relatively higher in the threshold area. If the head is used in stable conditions, it is generally possible to measure single shot pulses below the specified limit, though its value will be less accurate.
Please email service@us.ophiropt.com to request the spec sheet. We have many of the spec sheets available for immediate delivery via email, and all of the spec sheets can be emailed within 2 or 3 days.
The Ophir thermal sensors can measure up to 10% over their maximum average power rating, even though the meter will indicate "OVER".
The posts are 2.25” long.
The key to Helios’ ability to handle high powers with a small, uncooled body is the limit on exposure time. The specifications state a maximum accumulated energy of 10kJ, so one can hit the Helios with 12kW (max power) for up to about 0.8s.
The 2.5s response time of the Helios would indeed be problematic if it were measuring the power directly. In actuality it integrates the power received to measure the energy of the pulse. An internal photodiode is used to detect the pulse width. The power is then calculated by P = E / Δt.
Well, partly right.
Ophir has for many years had a few sensors that are designed for intermittent use. They are marked by two numbers like 50(150), which means it can measure 50 W continuously, or 150 W for a brief exposure (1.5 minutes in this example). Keeping in mind that power is energy over time, and that it is the total energy absorbed over time that causes a sensor to heat up, it should be possible to expose a sensor to “too high” power but only for a short time, and have the sensor survive the experience. The sensor can treat that short exposure as if it were just one long “single shot” pulse, and measure the energy of that pulse. Divide the energy by the (known) pulse width, and that gives the power during the pulse. (It can’t measure power directly this way, though, since a thermal sensor’s response time to power is itself a few seconds). For example, the moderate-power L40(250)A-LP2-50 has a 10KJ energy scale (several other sensors also have multi kJ scales); to measure power of an 8KW beam, we can fire the laser for 0.5 seconds with the sensor in energy mode, and we’ll measure 4KJ energy in the “pulse”. Dividing that by 0.5 seconds gives the 8KW beam power. Of course we then need to wait for the sensor to cool before repeating, but in some applications that may be perfectly OK
If you have a Juno, Juno+, Centauri or StarBright meter, you can do the above automatically, with any power sensor, using StarBright’s “Pulsed Power” function where you input the pulse duration and the meter will give the readout directly in power.
The new “LP2” type sensors are specially designed for beams having high power and high power density (and for pulsed beams, high energy density). The LP2 sensors are replacing the equivalent LP1 sensors; as impressive as the LP1 is, the LP2 was developed with the following improvements:
- Very high damage threshold, for both power density and energy density, for long pulse and CW beams;
- Spectrally flat; since its absorption remains constant at widely differing wavelengths, this means that sensors based on the LP2 can be used for "white light" or polychromatic beams;
- Very high level of absorption (as high as 96%, depending on wavelength), meaning much less light is scattered back, which for high power beams is an important benefit;
- The absorption is also largely independent of incident angle, which means it can be used for divergent beams too.
These sensors (e.g. 3A, 10A, 12A) are sensitive enough that even small air currents near the sensor can be picked up by them, and can result in some slow thermal drift in the reading. The “tube” (or “snout” as we sometimes call it) prevents this problem, or at least minimizes it, by reducing the degree to which air flow in the room becomes air flow near the sensor’s absorber surface, and also it limits the sensor’s solid angle “field of view”.
Using Your Sensor
Thermal sensors for intermittent use such as models 30(150)A, L40(250)A-BB-50 etc. can be used up to the powers in parenthesis for a period given approximately by the following formula: The rule of thumb is that you can use the sensor for 1 minute/watt/cm3 of sensor. So for 150 watts for 30(150)A you have 1minute*165cm3/150watt =~ a little over one minute. The sensor finder program calculates the allowability of intermittent use when the user fills out the choice for duty cycle.
There are a number of options, depending on the purpose.
- In many cases, the simplest solution could be to make use of the analog output of the meter – that gives a voltage signal proportional to the actual reading (it is in fact just a D/A translation of what is being displayed), so it represents a fully calibrated reading. The full scale value is a function of the meter being used and the power range it is on.
- The "SH to BNC connector" (Ophir P/N 7Z11010) simply takes the raw output from the detector element and sends it to the scope. It bypasses the sensor's EEROM which contains the calibration data, so it essentially turns the sensor into an uncalibrated "dumb" analog sensor. It should be noted, though, that in some cases we could be talking about a signal to the scope that may be low, perhaps even near the noise level of the scope, which limits the usefulness of this method at low powers.
- If the need is to see the pulse width – the temporal profile – the solution (assuming applicable specs) is to use an approprinte temporal sensor connected to a scope; you can point it anywhere where it will catch some backscatter from your laser, and you'll see the pulse temporal form as it really is.
It is fully compatible with these meters/interfaces:
- Vega / Nova II (firmware vs. 2.44 or higher)
- Juno (1.31 or higher)
- StarLite (1.26 or higher)
- StarBright (1.18 or higher)
- Centauri
- Juno+
- EA-1
It is partially compatible with Ophir’s other meters (Nova, LaserStar, Pulsar, and Quasar). It will function properly with these devices, except with an upper power limit of ~1 mW instead of 100 mW and with reduced accuracy, see specs for more details.
Yes, but keep in mind that the RM9 will measure average power, not energy. Also, pulse rates below ~50 Hz may generate additional noise. Pulse rates close to 18 Hz may cause beat frequency issues.
Yes, but it must be set to a chopping frequency of 18 Hz.
If your chopper has high emissivity (black) surfaces, it should be located as far from the sensor as possible, at least 200 to 300 mm.
If your chopper has low emissivity (bare metal) surfaces, care should be taken to ensure that when it blocks the laser beam it does not generate stray reflections that can reach the sensor
If your source happens to be pulsed at 18 Hz, you cannot use the chopper, since this will generate very low frequency beat signals. However, it might be possible to use the RM9 directly with your laser source, as long as you can connect a BNC sync to the RM9 sensor. Contact us about your particular application to be sure this is the right solution for you.
Yes. To do so, the smart plug should be attached to the Ophir smart sensor to BNC interface (Ophir P/N 1Z11010) and the output should be put into an amplifier with input impedance set to ~10KOhm.
Water cooled sensors will not work properly at all unless the sensor is filled with water to make thermal contact between the disc and sensor. If the sensor is filled with water and the input and output connectors are stopped up, then the sensor can be used for a short time without water flow or at much reduced power continuously. Note, however, that when used this way, the reading will likely be incorrect by 5-10% and the response time of the sensor may not be optimal and it may be slow or overshoot.
You can find a lot more information about the correct use of water-cooled sensors in the article "How to use water cooled Ophir sensors", here.
It is not necessary to cool it with water all the time. However, when the water is turned on, there is a transient period where the reading is not stable until the sensor adjusts to the water flow. Therefore, turn on the water before applying the laser and wait until you get a stable reading close to zero before applying the laser. This can take up to 1 minute.
You can find a lot more information about the correct use of water-cooled sensors in the article "How to use water cooled Ophir sensors", here.
The thermal sensor works by measuring the heat flowing through its sensor. When measuring a short pulse, the heat is absorbed in the sensor absorber and then flows out through the sensing elements. The integral of this heat flow is a measure of the energy. Thus the sensor is actually measuring the energy that flows after the pulse is finished and the pulse width does not matter for this measurement.
Ophir "Thermal" detectors have flat regions of response over their entire usable range. Ophir does a calibration for this flat region and when the detector is no longer flat it gets a new calibration for this new flat region. This is why there are regions instead of discrete wavelengths.
Thermal sensors can be ordered with a cable longer than standard 1.5 meter cable, in the following lengths: 3, 5, 10, and 12 meters.
Assuming the water temperature and flow rate are stable, the 2 possible concerns in such a case would be:
- Water condensation on the absorbing surface
- Offset caused by the difference between the ambient room temperature and the temperature of the sensor. The sensor "sees" 2 different temperatures – that of the cooling water flowing inside it, and that of the room air around it. If that temperature difference is small (as it usually is if the water temperature is in the usual specified range), then the air temperature's effect on the sensor body will be negligible compared with the cooling water temperature. However, if it is a large difference, there will be some level of heat flow between the (cold) sensor and the (warmer) air, and this will result in some level of offset in the reading.
You can find a lot more information about the correct use of water-cooled sensors in the article "How to use water cooled Ophir sensors", here.
The required flow rate is proportional to the power, i.e. (min flow rate) = (published flow rate at max power)*(actual power input)/(rated maximum power) with the provision that the minimum flow rate should not be less than 1/4 of the published rate at full power.
You can find a lot more information about the correct use of water-cooled sensors in the article "How to use water cooled Ophir sensors", here.
Yes. The BB type thermal sensors will give the correct measurement as long as the wavelength selection is set to the wavelength of the light illumination source.
The measurement for broadband light will be the sum total of the radiation at all wavelengths above and below the wavelength set. However, the accuracy of the reading will depend on how much variation there is in absorption over the entire spectrum. The BB coating is quite flat spectrally (see graph below). In the spectral range of 500nm-1200nm, typical for IPL, the variation in absorption is only about 1.5. So, the accuracy of measuring the total energy will be good as long as you set the wavelength setting to the VIS or <800 selection (which is calibrated at 532nm).
Many factors affect the risk of corrosion forming, but the two most important are:
- the mixture of ions in the water
- the water’s pH
Our current recommendation is to use DI water – but of a neutral pH. DI water is usually slightly acidic; it can be titrated to a neutral pH, using a bit of sodium hydroxide for example. There are also commercial additives that can help prevent corrosion, for instance Optishield Plus. For a more detailed discussion, see the FAQ at https://www.ophiropt.com/laser--measurement/knowledge-center/faq/7805
You can find a lot more information about the correct use of water-cooled sensors in the article "How to use water cooled Ophir sensors", here.
Corrosion is caused by interactions between the metallic components of the sensor and the cooling water, which may contain a variety of dissolved ions. Many factors affect the risk of corrosion forming, but the most important are the pH and the mixture of ions in the water. For this reason, we recommend using neutral deionized water in a closed circulating system (pH between 6 and 8). Please note that deionized water is usually slightly acidic (pH 5.65) due to absorption of CO2 from the atmosphere. The cooling water can be neutralized by adding 5 ml of a 10 mM solution of NaOH for each liter of water in the cooling system. Commercial additives such as Optishield Plus are also recommended for systems such as ours that have copper and aluminum in them. Optishield has the additional benefit of having biocide to prevent buildup of organic contamination.
To prevent corrosion it is also crucial to not allow standing water to evaporate inside the sensor when it is not in use. When disconnecting a sensor from the cooling system, the water channel should be cleared by blowing compressed air through it.
For those customers still experiencing problems with corrosion, we recommend the new thermal sensor 1000WP-BB-34 which has a special design in which all materials that come into contact with the cooling water are either copper or nonmetallic.
You can find a lot more information about the correct use of water-cooled sensors in the article "How to use water cooled Ophir sensors", here.
This sensor must have water flowing, since the way it works is by measuring (a) the temperature difference between inflowing and outflowing water, and (b) the water flow rate. In other words, the water is part of the measurement mechanism. This is unlike regular water-cooled thermopile sensors, which use water only for cooling – and hence can get away without it in some cases if thermal conditions permit.
Basic use with Profinet requires one power supply cable and one Profinet cable. Using RS232 or the PC application requires one power supply cable and one RS232 cable. If you want to use the Helios in a line/star topology, where it is daisy-chained with the next device in line, then you should use two power supply cables and two Profinet cables.
RS232 uses a standard DB9 RS232 cable. Profinet uses a Profinet-grade cable and RJ45 connectors. The power supply is a standard Profinet power supply from the Han PushPull series. For more information and mating connectors, see Chapter 3 of the manual.
This is limited by the temperature the Helios body reaches, that is measured by an internal sensor. The temperature shouldn’t be allowed to exceed 60° C. In our experience, this translates to about 40 kJ of accumulated exposure. Of course, the longer one waits in between pulses (allowing the body to cool), the more total energy it can take. That is why the temperature sensor should be used as the primary indicator of overheating, while 40 kJ should be treated as a rule of thumb.
There are seven LEDs for different status/error indications. From left to right (and top to bottom), the LEDs are:
- Power
- COM (Green)
- COM (Red)
- Link (Port 1)
- TX/RX (Port 1)
- Link (Port 2)
- TX/RX (Port 2)
For more detailed information, see Chapter 7 of the manual.
Use methanol and a tissue or clean air.
These sensors have a gold-coated reflecting cone, which can be easily scratched. If one of these sensors needs to be cleaned, we recommend blowing with clean air or nitrogen. If, however, the cone gets soiled (for example with something spilled on it), such that blowing is not enough to clean it, then there is a risk of the contaminant material getting “burned in” by laser radiation. In such a case, to avoid that risk, one should use a suitably soft tissue with solvent, and wipe as gently as possible.
Yes we do. Please see the article "How to use water cooled Ophir sensors", here.
In order to measure the fiber laser power we need to assure on one hand that the beam size on the absorber is not to small so as to exceed the power density requirements of the absorber and on the other hand that the beam size is not so large that it does not fit into the aperture. This necessitates two lengths of fiber adapter, the QBH-L & QBH-S
The QBH-L (P/N:7Z08348) is suited for beams with divergence angles of up to 120 mrad (for 86% of the beam), the minimum divergence angle depends on total power and the graph in the datasheet should be consulted for exact values.
The QBH-S (P/N:7Z08349) is suited for beams with divergence angles of up to 180 mrad (for 86% of the beam), the minimum divergence angle depends on total power and the graph in the datasheet should be consulted for exact values.
For more information please contact Ophir’s representatives.
For laser powers up to 1500W use the L1500W-LP2-50 (P/N: 7Z02772) sensor or the L1500W-BB-50 (P/N: 7Z02752) sensor.
For laser powers up to 5000W use the 5000W-LP2-50 (a) (P/N: 7Z02773) sensor or the 5000W-BB-50 (P/N: 7Z02754) sensor.
Note: (a) Please note that older versions of the above sensors do not have the requisite 4 threads on Ø70mm circle on their front flange and cannot be used with the QBH adapter
The fiber laser outputs a very high Power and concentrated beam. If any dust or foreign particle gets onto the fiber tip, it can cause a significant damage to your fiber. The enclosure of the QBH adapter excludes foreign particles and also protects the users from back scattered laser light.
No, the light scattered from the walls of the adapter that gets back to the sensor absorber is negligible and does not affect calibration.
We would not recommend doing that. Besides possibly affecting the correct performance of the sensor, there is a risk of potential damage to the laser if a small percentage of the beam is reflected (off the sensor’s reflective cone) back into it.
If the setup and the water cooling are all stable (of course, that should be checked), there is no reason - as far as the sensor is concerned - that the reading should show significant fluctuations. A simple way to diagnose this: Try placing a photodiode in front of the sensor and facing towards it. It will sample a bit of the back-reflected power from the sensor; looking at the photodiode’s output signal will tell you if the fluctuations are real or not.
The short answer: Yes. Now to explain: The question comes up because of the concern that the internal fast photodiode - which measures the exposure time (“pulse width”) - might get confused at sensing the end of an individual pulse within a pulsed beam, and incorrectly think that it has now measured the exposure time and needs to divide the measured energy by that time (which would of course be wrong). The Helios Plus is a bit smarter than that though; it looks simultaneously at the outputs from the fast photodiode AND from the (much slower) thermal sensor, and if it sees that the thermal sensor’s output has not “come back down”, then it knows what looked like the “end of the pulse” from the fast photodiode’s output is not really the end of the pulse.
Accuracy
Ophir's Photodiode PD300 and PD300-1W sensors offer automatic background subtraction so the measurement is not sensitive to room light. With "filter out" (i.e. the external filter removed for low light measurements), 2 separate detector elements are visible. The beam to be measured is incident only on the outer of the 2 detectors, but background light reaches both detectors. The instrument will show the power measured by the outer detector minus that measured by the inner detector.This patented method cancels out 95% - 98% of background light under normal room conditions, even if it is constantly changing.
It's +/-3% of the reading from full scale down to 5% of full scale. Below 5% of full scale one should switch to next range down for the best accurate linear results.
It works there but accuracy is very poor ~20% so it is not specified below 360nm. The PD300-UV is recommended for these shorter wavelengths.
No. We have carefully designed them that there are no such effects from multiple reflections. This is because we use only absorbing or diffusing type elements.
Using Your Sensor
Removing External Filter from PD300:
Step 1 – Starting position
Step 2
Step 3
Yes, the adapter is arranged so the user can use it either with filter out or in.
The PD300 sensors are not designed to measure with the fiber pushed up right against the detector surface. It may be reading lower in such a case due to saturation of the detector from the concentrated beam or higher due to back reflections off the detector and back again from the fiber tip. The optimal reading will be where the beam is expanded to a size of 2-5mm diameter. Therefore, you should back off the fiber to a distance where the beam has expanded somewhat. Do not back off too far, otherwise if the nominal beam size is larger than given above, you may lose some of the beam off the edges of the detector.
The PD300 series of photodiode-based sensors are calibrated with a full spectral curve using a scanning monochromator (plus a few laser "anchor points").
The wavelength ("Laser") setting tells the meter what wavelength is being used and hence what calibration factor to apply when a measurement is underway. It does not, however, physically limit the possibility of other wavelengths from entering. All light (within the sensor's specified range of course) entering the detector will be measured; the meter will apply the calibration factor meant for the selected wavelength, "thinking" that only that wavelength is present.
In other words, these sensors assume a monochromatic light source. Their relative spectral response is not flat and they are therefore not suited for broadband beams.
So, if you want to check one wavelength from a broadband source, you will need to use a wavelength filter that only passes that wavelength. Then you should set your meter to the appropriate wavelength to account for the detector's relative sensitivity.
Yes, the 5 default wavelengths are the discrete wavelengths that we have actually calibrated that sensor to NIST-Traceable standards. We have also run a spectrophotometer curve for that sensor and fitted that curve to the 5 discrete wavelengths that you see in the drop down menu. To set it to a wavelength that one needs (within its spectral bandwidth, i.e. 350-1100 nm for the PD300 and 200-1100 nm for the PD300_UV) one highlights one of drop down wavelengths in the drop down using the Down arrow key, and then you use the Right arrow selector to get into the menu for changing it. Then one uses the Up and Down and Right Arrow keys to select the wavelength that one wants to use it at. When done press SAVE and then SAVE again. Now it's stored in the E-PROM of the Smart Sensor connector and available for use. One can repeat the above procedure to store any 5 wavelengths that they use most often.
See the Video on how to change the sensor wavelength: http://www.youtube.com/watch?v=1qWXouQP18U
The agent can order a replacement filter with software to load into sensor to update sensor calibration curve.
The PD300-1W also has an extra ND filter glass, one with more attenuation. This sensor works at up to 1W, and at this higher power the extra ND glass gets hot; as a result, its absorption can change (becoming less absorbing) so it is not specified for use at above 10W/cm2. Not because it will damage there, but because it will not perform correctly there .
(It is worth noting that the PD300-3W has a different type of extra filter based on an evaporated reticle. This filter does not change its absorption when it gets hot, so can be used at up to 100W/cm2.)
For measuring power of a scanned beam we recommend using the BC20, and not the PD300. Since a scanned beam will spend only a fraction of the time of each scan on the detector, the average power measured by the detector will correspondingly be only a fraction of the actual power of the beam. The BC20 is specially designed for such applications by having a peak-hold circuit integrated in its electronics.
In general yes, but several technical issues need to be kept in mind (most of which are results of the fast physical response time of these sensors):
- The pulse rate should be more than about 30Hz, otherwise the reading is unstable. At higher pulse frequencies, the sensor will respond as if the beam were CW.
- It is possible for a pulsed beam to have average power within the sensor spec and yet have the energy of the pulses themselves be high enough to cause a momentary saturation of the sensor. It is important to be sure that pulse energy is also within sensor spec (the parameter "Max pulse energy" is included in all specs for the PD300 family, for just this reason).
- The beam diameter should be no less than about 1mm .
- The average power and power density restriction in the spec should not be exceeded
Note: At the maximum pulse energy limit given in the spec, the reading will be saturated by about 5%, i.e. the reading will be about 5% lower than it should be. At 1/3 the maximum, the saturation will be about 1%.
We don’t supply chillers, nor insist on specific models; the only important thing from our point of view is to simply keep to the requirements specified for the cooling water of the specific model of sensor, such as minimum flow rate at full power, water temperature range, and - more important than the actual water temperature - water temperature stability. The temperature of the water should not be changing by more than 1 deg/min (because changes in water temperature could cause heat flow in the sensor which would be detected as if it were laser power, and cause errors in the reading).
We also have a video on our site at https://www.ophiropt.com/laser-measurement-instruments/laser-power-energy-meters/knowledge-center/water-cooled-sensors-youtube, which discusses various issues and tips about water cooling. There is a short discussion of coolant pressure requirements in our FAQ section at https://www.ophiropt.com/laser--measurement/knowledge-center/faq/2404
It should be okay, as long as:
- the wavelength is not near the long wavelength limit where the PD300 has a large temperature dependence;
- there is no condensation on the window of the detector which could interfere with the beam and affect the reading.
We suggest the customer does an experiment with a stable laser source (such as a pointer laser) shining in through a window onto the detector while the unit is temperature cycled to see if the reading changes. The final measurement should be back at the original temperature so as to make sure the laser hasn’t changed.
The BC20 sensor was not intended to be used with the StarLite display. If you use the Nova II or Vega display it will work.
Although these sensors measure average power (of both CW and repetitively pulsed beams), not pulse energy, it is possible for a pulsed beam to have average power within the sensor’s rated limits and yet have the energy of the pulses themselves be high enough to cause a momentary saturation of the sensor. It is important to be sure that pulse energy is also within sensor spec – not just the average power. This is explained in detail in this White Paper.
Let’s look at an example. In the spec of the PD10-C, it gives the lowest measurable energy as 1nJ at wavelength 900nm. Let’s say the wavelength you work at is 633nm. Looking at the relative spectral sensitivity curve for this sensor (shown below), we see that the sensitivity at 633nm is only about 2/3 of what it is at 900nm (as seen in the attached spectral curve). That means that the lowest measurable energy at 633nm will be (1nJ / ⅔), or about 1.5nJ.
Special Photodiode Sensors
The BC20 has a peak measurement and hold circuit which measures the peak power on the detector and holds it. Therefore when a beam is scanned over the detector, when the beam is on the detector it goes up to a peak which corresponds to the same power the detector would measure if the beam was stationary and therefore the BC20 reads the correct power whether the beam is scanned or not. In order for the BC20 to do this, the beam must be on the detector (of size 10x10mm) for at least ~13µs and therefore this limits the scanning speed on the detector to 30,000 inch/s.
Integrating Sphere Theory
Integrating spheres are used when we have divergent light sources. As shown in the illustration, an integrating sphere has its inner surface coated with a surface that highly reflects (typically 99%) in a scattering, nonspecular way. Thus when a divergent beam hits the walls of the integrating sphere, the light is reflected and scattered many times until the light hitting any place on the walls of the sphere has the same intensity.
A detector placed in the sphere thus gets the same intensity as anywhere else and the power the detector detects is thus proportional to the total incident power independent of the beam divergence. (The detector is so arranged that it only sees scattered light and not the incident beam). An ideal integrating sphere has a surface with reflective properties are Lambertian. This means that light incident on the surface is scattered uniformly in all directions in the 2pi steradians solid angle above the surface. The surface used by Ophir closely approximates a Lambertian surface.
3A-IS Series
The 3A-IS series has two 50mm integrating spheres in series with a photodiode detector. The two series spheres scramble up the light very well thus giving output very independent of incident beam divergence angle. The two spheres in series also insure that the light hitting the detector is greatly reduced in intensity thus allowing use up to 3 Watts even though photodiodes saturate at about 1mW. There are two models, the 3A-IS with a silicon photodiode for 400 – 1100nm and the 3A-ISIRG with an InGaAs detector for 800 – 1700nm
The Ophir integrating sphere sensors, models 3A-IS and 3A-IS-IRG have a white diffuse reflecting coating on the inside of the integrating sphere. The sensitivity of the sensor is quite sensitive to the reflectivity of the coating. If the coating absorption goes up 1%, it can cause a 5% change in reading. Therefore, care must be taken not to soil or damage the white coating of the sensors. Also it may be a good idea to send the sensors for recalibration yearly.
The auxiliary LED is used to increase accuracy in cases where the source under measurement is reflective or protrudes into the integrating sphere. The auxiliary LED is used to measure this effect and calibrate it out.
For the most demanding accuracy requirements, a broadband source is used for the auxiliary lamp, and a spectrometer monitors the effect of self-absorption across the spectrum. For UVLEDs, in the limited spectral range of 350nm-400nm, using the auxiliary LED at 390nm is an efficient solution, and the error due to self-absorption is reduced from up to ±20% to up to ±5%.
No. the self-absorption measurement is a relative measurement, so keep the wavelength setting at wavelength of the LED you are measuring.
Not at this time. Contact Ophir to discuss your particular application.
This is easy with the PD300-MS all you need to do is place a drop of oil on the center of the sensor surface and immerse the objective lens in it. After measurement just wipe down the sensor and clean it for another use.
The sensor is large in order to 'catch' light coming out of the objective at large angles, it is most accurate when the light is centered on the surface – you should use the target on the backside of the sensor to position the sensor optimally.
Accuracy
All PE sensors are less accurate at a low percentage of full scale. Therefore it is always recommended to measure energies on the lowest range available (e.g. measure 1.8mJ on the 2mJ scale not the 20mJ scale). In order to get highest accuracy from your sensor, especially at low percentage of full scale, it should be zeroed against the meter the first time it is used with this meter. This is especially true for the PE-C series that can be used down to 3% of full scale if zeroed but can have an error of 2% at 10% of scale if not. The sensors are factory zeroed against the Vega/Nova II so need not be rezeroed if used with these types. If used with the Juno, Pulsar, USBI or LaserStar, they should be rezeroed. If zeroed with one type and then later used with a different type, they should be rezeroed the first time used with the different type.
Ophir pyroelectric sensors have a positive temperature coefficient of 0.2% per degC which means that if the sensor heats up 10 degrees, the reading will be 2% high. The newer PE-C series of pyroelectric sensors have a temperature sensor inside and this dependence is compensated for in the software. The PD10 and PD10-pJ sensors use photodiode detectors so their temperature coefficient is the same as the PD300 sensors as listed on the PD300 pages of the Ophir catalog.
The sensor will stop integrating after the pulse width setting is reached and will lose part of the pulse. It will then read low. For instance if you try to measure a pulse width of 200us on a pulse width setting of 100us, the sensor will probably ready about 50% of the true energy.
If the pulse repetition rate is close to the maximum allowable rate for the chosen pulse width option, the first 0.5-1s of readings may read incorrectly low. This is only a problem for long pulse width settings (exceeding ~5ms).
All Ophir pyroelectric sensors can measure average power with Ophir Power and Energy Meters. The instrument measures the number of pulses each second and multiplies the energy reading by the pulse rate. If the pulse rate is constant, then the accuracy of power measurement will be the same as the energy accuracy since the pulse rate measurement is very accurate.
Basically, as the pulse rate increases, the sensor has less and less time for its output signal from a given pulse to drop back to zero before the next pulse; this is a function of both the thermal and electrical time constants of the sensor. We have a number of “tricks” in the design to enable the sensor to work at much higher pulse rates than it otherwise would, but eventually a maximum pulse rate is reached above which the sensor’s response is no longer able to keep up; as it approaches that maximum pulse rate, the “additional error with frequency” begins to show up.
So, in theory, that additional error is negligible through most of the frequency range of the sensor, and becomes relevant from about 70-80% of the sensor’s maximum pulse rate and up.
In practice, this is not always the whole story; there are sometimes acoustic resonance effects in the crystal that cause “peaks” and “dips” in this frequency-related uncertainty, so the maximum specified “additional error with frequency” is not always necessarily at the maximum frequency. When we specify “additional error with frequency” as maximum +/- 1.5% to 25KHz, what we guarantee is no more than +/-1.5% at any point - not necessarily the end points.
Calibration
Approximately: 40% at 193nm, 45% at 250nm, 55% at 0.4um, 65% at 0.6um, 70% at 0.8um, 80% for 1 -3um
We only have data to 10.6um but have reason to believe that it absorbs >80% up to 40um.
It can be used and is calibrated but very poor accuracy ~15% and high reflectance ~85%
No. The diffuser transmits very little past 2.5um. Use the PE50-DIF-ER.
PE sensors are Pyro Electric and they require both a heating and cooling cycle to generate a voltage to produce the signal read by the display. With a CW laser the sensor is never able to go through the cooling cycle, so it does not generate the voltage needed to produce the signal read by the display. If you have a CW laser, it is better to use a Thermal or Photo Diode sensor depending on your laser’s wavelength. Please contact your local Ophir representative for assistance in selecting the correct sensor for your application.
Using Your Sensor
The Power and Energy Meters simply decides it is time for a sample and takes the next pulse that comes after that time, e.g. if it samples at 400 Hz, then every 1/400th of a second it is ready to take the next pulse that comes along.
The problem is most probably acoustic vibration. Pyroelectric sensors are sensitive to vibration as well as heat. On the most sensitive scales of sensitive sensors such as the PE9 and PE10, they may be very sensitive to vibration. The PE-C series of pyroelectric sensors have an adjustable threshold so you can set the threshold to a value above the noise level but below energies you want to measure and thus eliminate false triggering. You may also try putting a soft pliable material under the base of the sensor to damp out the vibrations.
I seem to be getting incorrect/ illogical readings with my pyroelectric sensor at low energy levels.
The problem is most probably false triggering caused by acoustic vibration. If the pulse frequency as shown on the meter jumps around, then acoustic vibration is almost certainly the problem. Pyroelectric sensors are sensitive to vibration, and they in fact detect acoustic pulses through the same physical mechanism with which they detect laser pulses. On the more sensitive scales of sensitive sensors such as the PE9 and PE10, they may be very sensitive to vibration. You can see this by setting such a sensor to a low energy scale (e.g. 2 mJ) and clapping your hand once, just above the sensor's surface; you will get a reading.
The Ophir PE-C series sensors have a trigger level that can be set to above the level causing false triggering but below the level you wish to measure. You may set the user adjustable threshold to above the noise level to eliminate the false triggering. An additional solution may be to put an acoustically absorbing material such as a thin piece of soft foam plastic under the base of the sensor to damp out any vibration; acoustic noise carries primarily through the base (rather than through the air).
The catalog specification states the maximum power a sensor can be used with and without the heat sink. The purpose of the heat sink is to keep the sensor temperature below the maximum permitted at higher average powers. If you use the sensor for a short time only, on the order of 1-2 minutes at a time, you should be able to measure up to the higher power given in the spec even without the heat sink.
Yes, all Ophir pyroelectric sensors can measure at rates as low as you want down to single pulses.
No, even though the scope adapter allows viewing of the actual electrical pulses coming out of the sensor and thus looking at higher repetition rates, the Power and Energy Meters is still needed to supply power to the sensor and to enable changing of ranges.
Our energy detectors measure the total energy deposited within a time window defined by the pulse width setting selected via the Power and Energy Meters. There is no minimum pulse width limitation since we are measuring the energy deposited, not power or peak power.
Above the maximum rep rate of the sensor, the reading starts dropping until presumably at some rep rate it does not respond at all. This is because the maximum rep rate of the sensor is a function of the electrical (i.e. “RC”) and thermal time constants of the sensor, and when you go beyond those, the sensor is physically unable to respond fast enough. This is not to be confused with going beyond the maximum rated pulse rate of the meter. The meter will sample the data at the meter’s maximum rate, and when the meter is ready for the next pulse it will sample the next one that comes in; the sensors, on the other hand, have a physical limitation on how fast they can respond to pulses altogether.
Before using the pyroelectric sensor for power or energy measurement, check that your laser power, energy and energy density do not exceed the head ratings. Use the laser damage test slide that has been sent with your sensor at the laser energy you want to measure to make sure it does not damage.
Please check the included data sheet or check on the website for the same information;
https://www.ophiropt.com/laser-measurement-instruments/laser-power-energy-meters/products/energy-sensors/pyroelectric-energy-sensors
With the pyroelectric head, you have been supplied a test slide with the same coating as on your pyroelectric detector. You can also obtain this slide from your dealer. You should use this slide to test the damage threshold with your laser pulses. If the slide is damaged, then either enlarge your beam or lower the laser energy until damage is no longer seen.
The new PE-C sensors use a different pin on the D15 connector for the voltage output from the sensor than the previous sensors. All other meters can accept the voltage on either of two pins, so they work with either the previous sensors or the PE-C series. But the Nova does not have this additional input. Therefore, in order for a Nova to work with the PE-C series, an adapter, Ophir P/N 7Z08272 has been made available. The adapter plugs between the D15 socket of the Nova and the D15 plug from the PE-C sensor. If you want to use the Nova RS232 PC adapter, this can be plugged in as well onto the PE-C adapter and used at the same time. Note that the Nova does not support all the new features of the PE-C family such as user threshold and 5 different pulse width settings but will support all the features that were available on the previous PE line.
The SH-to-BNC Adapter is meant only for power sensors, i.e. thermal or PD300 type sensors. For seeing an analog representation of energy measured by a pyro sensor, including Pyro-C sensors (other than using the AN OUT from the meter), we have the PE Scope Adapter. It is different that the SH-BNC adapter used for power sensors. With the pyro scope adapter connected between the pyro sensor and the meter, you can look at the output of every single pulse on an oscilloscope at up to the maximum pulse rate of the sensor, even if that is beyond the maximum pulse rate of the meter. Unlike "dumb" sensors, here you look at a square output after signal processing where the voltage is approximately proportional to pulse energy. (The temporal shape of the pulse form on the scope, however, is not related to that of the laser pulse; it is a function of the sensor's electronics).
In general, pyroelectric sensors physically respond only to pulsed sources (the pyroelectric crystal itself responds to the acoustic pulse – essentially a heat pulse – resulting from absorbing a light pulse). The heat from the laser itself is presumably not pulsed, so it shouldn’t directly affect the reading. Note that pyroelectric detectors have a temperature coefficient of sensitivity, on the order of 0.2%/degC. The “PE-C” type sensors (Ophir’s current line of pyroelectric energy sensors) have built in temperature compensation that eliminates most of this variation, but if your laser significantly heats the nearby sensor, then the compensation may not be perfect.
The old pyro sensors and the newer PE-C sensors are almost identical; the differences between them are as follows:
- More compact
- User Threshold – minimum energy threshold (below which the sensor will not trigger) can be selected according to users' needs
- Measures longer pulses (up to 20ms depending on model)
- Has up to 5 pulse width settings as opposed to only 2 pulse width settings
Disadvantages:
Smaller size and therefore:
- May need a heat sink (P/N 7Z08267) in order to stand up to higher average powers
- May need a mechanical size adapter (P/N 7Z08273) if it must fit into an existing mechanical jig designed for the older models
Meters and Software Support:
StarLite, Juno, Vega, & Nova II fully support the Pyro-C series. Laserstar, Pulsar, USBI, Quasar, and Nova / Orion with adapter* partially support the Pyro-C series:
- Only 2 of the 5 pulse width settings are available
- Lowest measureable energy cannot be selected (no User Threshold).
StarLab software supports both Pyro-C and older pyro series.
*Note: The PE-C series will only operate with Nova / Orion meters with an additional adapter Ophir P/N 7Z08272 (see details in Ophir website).
Wavelength Setting Names:
If you have your own software for communicating with the sensor, it may be important to note that for some models, the names of the wavelength settings are a bit different between the old pyro and the new PE-C, even though they mean exactly the same thing.
For example, with diffuser OUT, the settings in the PE50BB-DIF-V2 are called “<.8u” (i.e. visible, represented by a calibration point at 532nm that covers the full visible range), and “106” (i.e. 1064nm), while in the PE50BB-DIF-C these same settings are called “532” (i.e. 532nm, the calibration point for the visible) and “1064”.
When logging energy measurements on a PC with the StarLab software from a Pyro sensor via either a Nova-II, or Vega, or a USB enabled StarLite meter, the timestamp for each Energy pulse measured in the log is provided entirely by the clock on the PC which has millisecond resolution. (Note: Because a timestamp provided by a multitasking Windows PC is not from a true real time system, there could be instances where the timestamp is not well synced with the actual energy pulse measurement in the log, depending on how ‘burdened’ the computer was at any particular moment.)
When logging energy measurements on a PC with the StarLab software from a Pyro sensor via either a StarBright, Juno or Pulsar, each of these meters provides a precise microsecond resolution timestamp from their on-board clock.
This timestamp is synced to the Energy measurement and the data is written together in the log. The precise on-board clock in the StarBright, Juno or the Pulsar is used here to determine the time differences between measurements - rather than the PC clock which is used here just to set the initial baseline time of the log. This is the best method to log Energy if timing of pulses is critical.
As opposed to Pyro Energy measurements, when logging Power measurements on a PC via StarLab with either Photodiode or Thermopile sensors, where fast measurements are not required anyway, the log timestamp is provided entirely by the millisecond resolution clock on the PC when connected to any of our meters.
If the energy is just a bit over-range, up to 10% above the top of the scale, the meter will give a correct reading of energy and frequency, together with an “Over” warning. If the energy is way above the top of the scale, though, the reading will very likely be nonsensical, but without the “Over” warning. With Ophir’s Pyro-C energy sensors, there is never a “saturation” message on the meter - the output from the sensor can never actually reach saturation. Of course, being “way over” the top of a measurement scale – and not noticing - is not a likely scenario. Common sense is often the best defense.
In theory, if a beam is completely parallel and fits within the aperture of a sensor, then it should make no difference at all what the distance is; it will be the same number of photons (ignoring absorption by the air, which is negligible except in the UV below 250nm). If, nevertheless, you do see such a distance dependence, there could be one of the following effects happening:
- If you are using a thermal type power sensor, you might actually be measuring heat from the laser itself; when very close to the laser, the thermal sensor might be “feeling” the laser’s own heat. That would not, however, continue to have an effect at more than a few cm distance unless the light source is weak and the heat source is strong.
- Beam geometry – The beam may not be parallel and may be diverging. Often, the lower intensity wings of the beam have greater divergence rate than the main portion of the beam. These may be missing the sensor's aperture as the distance increases. To check that you'd need to use a profiler, or perhaps a BeamTrack PPS (Power/Position/Size) sensor.
- If you are measuring pulse energies with a diffuser-based pyroelectric sensor: Some users find that when they start with the sensor right up close to the laser and move it away, the readings drop sharply (typically by some 6%) over the first few cm. This is likely caused by multiple reflections between the diffuser and the laser device, which at the closest distance might be causing an incorrectly high reading. You should back off from the source by at least some 5cm, more if the beam is not too divergent.
Needless to say, it’s also important to be sure to have a steady setup; a sensor held by hand could easily be moved around involuntarily, which could cause partial or complete missing of the sensor’s aperture at increasing distance, particularly for an invisible beam.
Pyroelectric sensors are energy sensors, meaning they measure the energy of pulsed laser sources…not the power of steady-state CW sources. In order for pyroelectric sensors to output a measurement a single shot or repetitively pulsed laser source is required. If you are trying to verify that a pyroelectric sensor is operating and currently do not have a pulsed laser source to direct onto it, they will usually output various measurements when tapping on the mechanical housing indicating that they are operating OK.
StarBright & StarLite
No. The pyroelectric sensors must be the PE-C type sensors to work with the StarBright and StarLite meters.
General
Select the range that contains your wavelength. The sensors have coatings on them that have been characterized and for any wavelength within that range the sensor will be within calibration tolderance including variations in sensitivity within that range. When there is a difference in sensitivity that exceeds the allowable tolerances, a new wavelength range is created and a calibrated for.
Think of it like a voltmeter or ammeter, these have to be recertified/recalibrated as well like most other pieces of test equipment. In general, our instruments are unlikely to drift or fail over time like a sensor might that is constantly exposed to laser energy. But the possibility exists. So the general practice in our industry is to have Power and Energy Meterss recalibrated and recertified as well. ISO standards and FDA, as well as other agencies, require both be recalibrated and recertified.
If the firmware programming procedure doesn’t complete, you should be able to recover and reprogram the StarLite firmware.
- Make sure to completely power down the StarLite, as is mentioned in the StarLite Upgrade Tool screen instructions (long press On/Off button).
- If unsure that StarLite has really shut down, it’s advisable to try disconnecting the USB cable and then power down the StarLite.
- Reconnect the USB cable.
Then proceed (again) with the StarLite Field Upgrade Tool: Turn StarLite on in the special ‘burn-in’ mode by pressing the two button combination as detailed in the onscreen instructions, (you should hear from the PC speakers the ‘ding dong’ tone associated with a device being connected to the PC), and then continue the steps as prompted. If problems continue, please contact Ophir-Spiricon Service at service@us.ophiropt.com.
The meters and sensors are calibrated separately and either sensor will work with either Vega meter.
All Ophir meters use a 12 bit A-to-D, however the output range given is about 10% above the 100% level and also 10% below the zero level. In actuality this give 11.5 bits resolution between 0% and 100%.
Vega | Nova II | Nova | Laserstar | StarBright | StarLite | |
resolution | 11.5 bit | 11.5 bit | 11.5 bit | 11.5 bit | 11.5 bit | 11.5 bit |
update rate/s | 15 | 15 | 15 | 15, 25/s for pyro sensors | 15 | 15 |
The latest firmware for all meters except the Nova includes the ability to automatically read different sensor information, when it is connected, without the requirement to power the meter Off an On again.
Some of the older software versions require you to turn the meter off and on to register the new sensor.
The latest firmware for the upgrading the meters is available at;
Recommended but not guaranteed: Operating: 15 - 35degC. Storage: 0 - 50degC.
The sensors with a continual response curve such as the ones listed above come with preset "favorite" wavelengths. If these "favorite" wavelengths do not match the application wavelength you are using they can be changed by performing the instructions below, which are for the Vega meter. For your specific meter, please see the User Manual.
- While the Vega is off, plug in the head. Switch on the Vega.
- From the main measurement screen, press "Laser" to select the correct laser wavelength. If you want to save this new wavelength as the startup default, press "Save" before exiting. If the wavelength you want is not among the wavelengths in the six wavelengths listed and you want to change or add a wavelength, see the next step
- Changing Chosen Wavelengths:
- From the power measurement screen select "Laser" and enter. Move to the wavelength you wish to change or add. Press the right navigation key.
- Using the up/down keys to change each number and the right/left keys to move to the next number, key in the desired wavelength. Press the Enter key to exit. If you wish to save this new wavelength as one of the 6 favorite wavelengths, press "Save".
Note: Saving the new wavelength in the Modify screen will not set this wavelength as the default startup wavelength. To do so, you must follow the instructions in Step 2 above.
The policy is to support Ophir equipment for 7 years after it is discontinued. That means we will continue to re-calibrate it and provide repair support for it.
The energy meters will then sample at close to its maximum frequency. For instance measuring 10 KHz with a PD10 Sensor and Nova II where the maximum frequency for every pulse on the Nova II is 4 KHz: in this case, the Nova II will pick out pulses at a rate of close to 4 KHz and sample them, i.e. the Nova II will record 40% of the pulses.
In all Ophir instruments, all adjustments, including zeroing internal circuits, are done from the software. This ensures simple and accurate realignment. The zeroing process helps eliminate internal biases in the unit which could affect accuracy of measurements. It is recommended to re-zero the instrument every 2 months for best performance. Specific instructions for doing this are found in the relevant User Manual for each instrument.
No, only Ophir power/energy sensors with the Smart Head connection will work with the Ophir power/energy meters.
Yes, the battery needs to be replaced. A new battery should last 8 hours per charge. We recommend that you send the meter back for battery replacement and recalibration. User battery replacement is possible. For battery part numbers and ordering information, go to https://www.ophiropt.com/laser--measurement/spare-parts.
For the best accuracy and repeatability, each Ophir meter should be zeroed with no sensor connected periodically. It would not hurt to zero the meter each time it is used, but we recommend to zero the meter at least once a month. See your meter User Guide for the zeroing procedure particular to your meter. To view or download a copy of the meter User Guides, follow this link: https://www.ophiropt.com/laser-measurement-instruments/laser-power-energy-meters/services/manuals.
Ophir hand held displays are shipped with a 2-conducter 2.5mm mono audio jack connector that you can plug into the top of the display to get the analog signal out of the display. You will need to solder your own cable onto the connector.
No, the driver will not install properly unless you do use the Ophir meter USB cable.
No, the firmware upgrade is independent of the calibration and does not affect it.
The Ophir meter model AN/2 is obsolete and is no longer supported for repairs, but it can be calibrated if it is in working condition.
We do have a listing of replacement parts for the Ophir power meters available on our web site at; https://www.ophiropt.com/laser--measurement/spare-parts
The analog output of the meter - using the mating connector provided – gives a voltage signal proportional to the actual reading (it is in fact just a D/A translation of what is being displayed), so it represents a fully calibrated reading. The full scale value is a function of the meter being used and the power range it is on. With the StarBright, Vega and Nova II, for example, the user can select full scale analog output voltage ranges of 1v, 2v, 5v or 10v, and the 100% level of the chosen power scale is scaled to the full scale voltage. For example: if you choose 5V full scale analog voltage range, and your sensor is set to a 50W full scale power range, then you will have 5V = 50W or 0.1 V/W. It will vary according to the chosen power range and chosen full scale voltage range. The electrical accuracy is stated in the specification (see the User manual) as ±0.2% (of reading) ±0.3% of full scale volts (in addition to the calibration accuracy of the sensor’s reading itself).
The choice of meter depends on what range of functionality you need (unlike the choice of sensor, which depends on the technical, physical parameters of the laser). Just to give a quick general idea:
- For just basic measurements, no graphics or analysis, and/or when budget is tight, the StarLite is a good choice.
- If you might want to connect your StarLite to a PC, getting the StarLite with the USB Enabling added will allow you to connect to a PC with the "StarLab" laser measurement application running.
- For a solid set of functions, perhaps onboard logging, things like Density, Limits etc, then Vega
- For higher capabilities, combined functions, graphic display options, etc, then StarBright
- For working only connected to a PC (as opposed to also working stand-alone), a PC interface such as Juno
You may find our Meter Finder very helpful - a detailed comparison table of features and capabilities of the various Ophir instruments. And, needless to say – feel free to ask Ophir for help!
Yes. The meter will then come on automatically when the power supply is connected, without pressing the ON button. The idea is intended for when a meter is integrated into a larger machine, so that when the machine is powered up, the meter also comes on without having to have physical access to the buttons on the meter.
Centauri
They are related, but not exactly the same. “Raw” is one of two options for setting the Analog Output. Basically, the Analog Output can be set by the user in 2 ways:
- The source of the Analog Output is the processed (Digital) reading, in which case the Analog Output voltage represents the calibrated laser power (this is what is normally meant by “Analog Output”);
- The source of the Analog Output is the unprocessed sensor input (Raw). In this case, the analog output voltage is a continuous non-digitized output. It is derived directly from the amplified sensor input signal, with little conditioning. The ‘Raw’ analog output option can be useful for analyzing the temporal shape of fast laser pulses.
Vega & Nova II
The Power and Energy Meter's software can be upgraded by the customer using Ophir's StarLab PC application available for download from the Ophir website.
1. Attach the Power and Energy Meters to your PC with the USB cable provided with the Power and Energy Meters.
2. Go to the bottom of the StarLab page and download the firmware for your Power and Energy Meters
3. Run the StarLab application
4. Select your Power and Energy Meters device and press Diagnostics
5. Select your meter and press the Upgrade button
6. Follow all the on-screen instructions to successfully reprogram the display.
These instructions, including screen captures, can be found at https://www.ophiropt.com/laser-measurement-instruments/laser-power-energy-meters/software/upgrade-firmware
If the field-upgrade process fails (example, unplug of the USB cable during the upgrade), the Power and Energy Meters will not function properly. Therefore, when turning on the Power and Energy Meters the user gets a blank screen. Note: The Power and Energy Meters can still communicate with the PC. Try to reinstall the Power and Energy Meters software as described above.
All Ophir meters (except the Nova and Laserstar) have a momentary push button switch to both turn them on and turn them off. The push button action to turn them on is a press-and-release-quickly action. The push button action to turn them off is a press-and-hold action, until the meter turns off. A short press when the meter is on will turn on the backlight.
This can sometimes happen when the battery of the Power and Energy Meters is completely discharged and then the charger is plugged in. The Power and Energy Meters is powered up but the contrast voltage on the LCD is not functioning, so it looks as though it is off; and usually the backlight switches on and off normally.
The solution is to first switch OFF the Power and Energy Meters properly by pressing the On/Off button for 4-5 seconds, and then switching it back ON by momentarily pressing the On/Off button, as normal.
The Power and Energy Meters will also fail to operate if you attempted to download a software upgrade and there was a malfunction in the download, see the question "Can I upgrade?" below.
You can try our Nova II demo online. It can be found here. You can use this demo to connect to different sensor styles and check the meter’s and sensor’s functionality. You can also simulate a laser by imputing exposure levels. This simulator does not allow you to try every sensor, but it can give you an idea how the meters work and how sensors interface with the meter.
LaserStar
It can work with any sensors in dual mode where they are operating separately but for ratio or difference it can only work with pyro vs. pyro or thermal/photodiode vs. thermal/photodiode.
This can be done with the Spagent program and a Kiethley GPIB PC card. Please contact Ophir engineering for details.
We have a special plug which allows this. Ophir P/N 1Z11006.
Offset is entered for each sensor separately. You choose "Active Sensor: A", then set offset for sensor A in the usual manner, then go back and choose "Active Sensor: B" and repeat. This also makes the most sense, since each sensor might in fact need a separate offset.
Please note: After activating “OFFSET” for each sensor separately, when you then work in “BOTH” mode, you no longer see “OFFSET” shown on the screen; nevertheless, the “OFFSET” function is still in fact working.
USB
All USB speaking devices (EA-1, Juno, Juno+, Pulsar and USBI as well as the StarBright, Centauri, Vega, Nova-II, and StarLite Power and Energy Meters) can be controlled via our StarLab. This provides full remote control and measurement capabilities. In addition, system integrators can make use of the OphirLMMeasurement COM object for all of our USB speaking devices that are included in the application installation. Documentation and Examples in Visual Basic, LabVIEW are found in the "Automation Examples" sub-directory of your StarLab directory.
StarCom is our legacy PC application which connects via RS232 (not USB), for old Ophir instruments having RS232 interface capability (Vega, Nova II, LaserStar and Nova). It performs all basic functions such as real-time data logging, saving data in PC file, off-line data viewing, printing, etc. For a relatively new computer, you'd have to check that it has a serial port to which to connect the meter. The last release of StarCom was in 2008, with all that this implies. StarCom should nevertheless be able to work on a Win7 32 bit PC. More information, including software download, is available at https://www.ophiropt.com/laser-measurement-instruments/laser-power-energy-meters/software/starcom.
StarLab is our full-featured PC application that connects via USB to all Ophir USB-speaking instruments (Centauri, StarBright, StarLite, Vega and Nova II meters, as well as Juno, Juno+, EA-1, Pulsar and the Bluetooth-enabled Quasar PC interfaces). In addition to all basic measurement and data logging functions, it also offers a wide range of special functions (including user-defined mathematical functions), multi-channel operation, COM Object for integration with external systems, etc. More information, and software download, is available at https://www.ophiropt.com/en/laser-measurement-instruments/laser-power-energy-meters/software/starlab.
In theory USB supports up to 127 devices.
We recently had 12 sensors connected to StarLab, and it worked normally. The practical limitation is basically how many channels you can realistically see on the display (which would not be a limitation if you will only be logging the data), and of course the number of available USB ports/hubs.
Whenever we release a new version of StarLab we add support or deal with various other meter-specific issues. This may necessitate upgrading the meter firmware to the latest release. This release is included in the StarLab package and simply enter the Field Upgrade dialog in order to upgrade your meter to be up to date.
The Analog output for Pyro sensor can measure up to 10 Hz. Therefore if you want to measure at a higher frequency (up to the maximum frequency of the sensor), you can connect the Scope Adapter for Pyro sensor (Ophir P/N 1Z11012). This adapter provide a BNC output to scope to see every pulse up to the maximum sensor frequency. Note: The Pulsar device is not equipped with an analog output
This software package is free, and when combined with our USB-capable meters such as Vega or Nova II, or our USB based PC interfaces such as Juno, Pulsar and USBI, it is the ultimate in live data viewing, collection and analysis of laser power and energy measurements.
StarLab is a standalone software package that is very modular. Use it with up to 8 instruments or PC Interfaces to display and collect data from all 8 simultaneously. You can perform math functions like A/B, A-B, A+B, or A*B. Display all on one coordinate system with a different color for each, or split them into several windows. View data in line, bar graph, histogram, or use our simulated analog meter with or without hysteresis. Get live statistics like min, max, average, and std. dev., or select batch size for stats. There's more:
- Measure power and/or energy density , based on user defined beam size.
- Time-synched multi-channel logs to a single log file for later review.
- COM Object for system integrators including in LabVIEW.
If you have one of our instruments with USB or our USB interfaces, download it for free and try it out. If you don't have one of our instruments or USB interfaces contact us, and set up a free demonstration in your lab or production floor. You can download it from this page.
The big difference between StarLab 3.40 and 3.31 is the enhanced support for our new Centauri dual channel meter. (Go download it free now and you'll see what I mean.) There are two other major improvements that I should mention:
- Added Low freq Power (Aka VCSEL) support for: Centauri, StarBright, Juno, Juno + and EA-1
- Added Power from Pulse support for Centauri, StarBright, Juno and Juno +
Find out more (and download StarLab) on the product page.
When installing StarLab, there is usually no need to uninstall or delete Previous StarLab releases, although it might be best in order to avoid confusion between the StarLab versions, and to keep the PC clean and tidy.
If you'd like to uninstall the old version, it's best to do so before installing the new StarLab release. If you uninstall a previous release of StarLab, after installing the new StarLab, you might need to re-register the drivers (and COM object if using it) via "Registration" under the StarLab options menu gear:
Note:
Uninstalling previous releases of StarLab will remove the files and folder names created when the previous StarLab was originally installed, but will leave/preserve other files and folders with other names created by the user (such as log files or COM automation code files) even if left in the previous StarLab folders, as long as the files were saved under a name other than the original demo codes we supplied.
In the main menu, select Options>>Preferences>>logging, and enable the "Open Log Viewer Automatically" check box.
USBI was upgraded to StarLab, which is compatible with Windows 7 (32 and 64-bit). Download the latest version of StarLab here.
Sometimes an application requires logging power from multiple power sensors, and being able to compare readings from the different sensors; in such cases, it is necessary to know to what degree the time points of each “channel” are in synch with each other.
Possible solutions would be to use a 2-channel Pulsar, or for example 2 Juno/Juno+.
With Ophir power sensors, the logged data timestamps originate from the PC, with millisecond resolution, for both Pulsar’s and Juno/Juno+.
So basically there is no difference between a Pulsar and a Juno/Juno+ in that respect. They will perform the same.
Each measurement will have its own separate timestamp, and will not have the exact same zero point; however, they will be ‘synced’ to each other to within a millisecond or so. Keep in mind that with power measurements, the instrument’s A/D sampling rate of the power signal is 15Hz (i.e. every 66.67 msec), so for all practical purposes the 2 channels can be considered in synch with each other.
Ethernet
The EA-1 can be powered directly from the Ethernet bus if PoE (Power over Ethernet) is available. If not, it can use a 12 24 VDC standard Ophir power supply.
Besides the Ethernet Adapter itself, the package also includes:
- Ethernet cross cable
- USB-A to USB-Mini-B
- 12 VDC power supply
- CD (for PC application, manual, and drivers for using USB virtual COM port)
- Brackets, screws, and an Allen wrench for mounting
There are three ways to connect to the EA-1 adapter:
- Telnet:
Establish a connection using the IP address of the EA-1. The host (e.g., PC) is considered the “client,” while the EA-1 is the “server.” - HTTP:
The IP address of the EA-1 should be entered into a regular web browser. This will show a top-level “web-page” with several buttons for accessing lower level pages. Commands can also be sent directly with the HTTP protocol. Client and server status are the same as above (Telnet). - USB virtual COM port:
For configuration and initialization only. This can be used to set the IP address for the first time or switch between dynamic and static IP address modes.
More details can be found in the EA-1 manual.
Yes. See chapter 6 of the manual.
Thermal, photodiode, and BeamTrack (power/position/size) sensors; pyroelectric and photodiode energy sensors; standard and smart plug (“-SH”) OEM sensors. (Note that the OphirEthernetApp PC Application does not support BeamTrack, but BeamTrack can be controlled by using commands.)
The device is shipped with these defaults:
IP Address .................................... | 10.0.0.2 |
Subnet Mask ................................. | 255.255.255.0 |
Default Gateway ............................ | 10.0.0.1 |
User Device Name ......................... | (blank) |
IP Address allocation ...................... | static (DHCP disabled) |
The IP address can be set via HTTP, Telnet, USB virtual COM port, or the “OphirEthernetApp” software. See Chapter 2 of the manual for step-by-step instructions for each method.
Yes it can. You can find a good set of guidelines in the following article: Tips using the EA-1 with a PLC. Complete instructions can of course be found in the EA-1 User Manual.
Bluetooth
In actual testing done at customer sites, using the high power option, there was not a place within 100 meters that we could not connect, including going through multiple walls that were made of drywall. The only time we lost transmission was when the walls were made of concrete or we had to pass through some metal doors. With normal labs and offices the signal went right through. In several cases, including a solar power scribing application where windowed doors had to be closed, we were getting a continuous connection as we walked around the spacious building into offices and labs. With the standard range option, the range should be about 1/3 of this i.e. 30 meters.
Quasar runs on Bluetooth, the 2.4-2.5GHz "ISM" band (ISM = Industrial, Scientific and Medical). This is the same band used by WiFi and other technologies. This frequency was chosen as it is available without restrictions around the world. Because other technologies also use it, Bluetooth has to be designed to tolerate interference from other sources. It does this by swapping between 79 channels, at 2.402GHz up to 2.480GHz (each channel is 1MHz). This type of modulation is called FHSS, Frequency Hopping Spread Spectrum. If data does not get through on one channel it retries on a different channel. Other technologies, such as WiFi, use different techniques.
This design makes Bluetooth very robust. In principle, if there is another radio transmitter nearby that is using the same 2.4-2.5GHz band AND using the same modulation scheme, interference is a possibility, but not a real likelihood. If the other transmitter is using a different band, there should not be a problem, because there is very little interference produced at other higher or lower frequencies - this is checked during qualification of these devices for CE and FCC in RF test labs.
In general, Bluetooth is in common use everywhere, by cellular phone headsets, for example, so interference is not normally a significant risk factor.
Yes, we have an Android app that you can download from the Android Market place to run your Quasar on your Android device. Search for Ophir Optronics Quasar. You need to be running Android 2.3.3 or higher.
If using the Bluetooth radio USB adaptor supplied with the Quasar, the adaptor software should be installed first. Once that is complete, and the StarLab software installation is complete, you are ready to connect the Quasar. You may need to change the discovery settings on your PC to allow the Quasar to connect.
To accomplish this, go to the Bluetooth Settings on your PC and ensure you have checked "Allow Bluetooth devices to find this computer".
You absolutely can use the Quasar to do data collection, but how similar the process will be depends on the type of sensor being used. If you are using Ophir Thermopile and Photodiode sensors, these work much the same way on the Quasar as they do on the Nova-II. You should be able to collect data in much the same way as you do today. You just need to establish a Bluetooth connection, open a COM port on the PC, and then can send commands as with the Nova II. You might need a small amount of low level code just to send/receive the commands and strip the prefix/suffix, which is not difficult. Ophir-Spiricon tech support can help.
The Quasar is no different than the other instruments that have electronic components: it requires annual recalibration. But it’s up to the customer whether to do this or not. We know that the calibration of the instruments degrades somewhat over time, as shown in the datasheet. This may or may not affect your particular application. To maintain compliance with ISO and other standards, we highly encourage annual recalibration.
Unfortunately, this is not possible, at this point. The Quasar can establish a connection with only one host PC at a time. If you connect to the laptop in the clean room, you will not be able to then connect to another PC in an adjacent office; the Quasar will be locked out. You would have to cut the connection on the laptop before you could establish the connection to the second PC. On the other hand, the beauty of the Quasar is that you can ONLY connect to the second PC in the adjacent room, outside the clean room, and log all the data from there. There is no need for a laptop in the clean room, unless of course, if you need to observe data while in there, in which case you would have to do the above.
StarLab
There is no time limit with the StarLab logging time – you can set ‘Unlimited’ logging in the log settings. (Note that, although StarLab does not impose any limits, there may be PC issues such as available disk space that could impose some upper limit.)
Unfortunately the interface described above is not sufficient to establish the correct communication protocol for the computer USB to interface to the Nova II or Vega meter. The original USB cable (one is provided with each Nova II and Vega meter) is required for the StarLab software to communicate OK. The USB cable is P/N 7E01205 and is available to order.
Reinstall StarLab and it will fix this problem.
Yes, StarLab 3.40 and higher is compatible with Windows 7 / 8 / 10 - 32 & 64 bit. For more information and to download, see the StarLab page
• RS232 Programming Commands The Ophir power meters that are supported through RS232 can be controlled remotely by a variety of programming languages. The programming and command information is available in the StarCom User Manual Appendix A, Guide to Programmers.
StarLab 3.50 does include new features which may require a firmware upgrade of the meter or PC interface, I.E. Juno, in order to operate with it. The required firmware is included with StarLab 3.50, but you do need to click on the More… link in the Select Device(s) menu in order to launch the Diagnostics menu and then proceed with the Upgrade firmware procedure. After performing the firmware upgrade, the meter or PC interface will connect with StarLab and operate normally. Note; Upgrading the firmware will not affect calibration.
The big difference between StarLab 3.40 and 3.31 is the enhanced support for our new Centauri dual channel meter. (Go download it free now and you'll see what I mean.) There are two other major improvements that I should mention:
- Added Low freq Power (Aka VCSEL) support for: Centauri, StarBright, Juno, Juno + and EA-1
- Added Power from Pulse support for Centauri, StarBright, Juno and Juno +
Find out more (and download StarLab) on the product page.
The present StarLab version no longer supports Windows XP.
For customers with Windows XP, download the older version Download v3.31
LabVIEW Libraries
Libraries for Nova and LaserStar were developed in LabVIEW 6.1. They have been tested and found compatible with LabVIEW 7.0 and LabVIEW 8.6.1 as well.
The library for Nova-II, Vega, and Juno support (OphirInstr) was developed in LabVIEW 8.6.1 and has been tested with NI-VISA 4.6.2. It also includes support for the Single Channel LaserStar. This has been tested in LabVIEW 2009 as well.
The library for Pulsar support (DemoForPulsar) was developed in LabVIEW 7.0 and tested in LabVIEW 8.6.1 as well.
The new LabVIEW COM Demo that supports the Juno, Vega, Nova-II, Pulsar devices was developed in LabVIEW 8.6.1 and has been tested in LabVIEW 8.6, LabVIEW 2009 and LabVIEW 2013 as well.
Device responses take the form 1.234 (a period distinguishes between the integer and fractional part of a real number). This may not match the settings of the computer upon which the VI is running. For example, many European countries use a comma (",") in place of a period (1,234). This causes the LabVIEW VI to not "understand" the devices's response.
(Go to http://zone.ni.com/devzone/conceptd.nsf/webmain/99d21982a9f954e186256a5b0057919e the section on Period and Comma Decimal Separators for National Instrument's explanation)
Solution: LabVIEW allows the User to override the local regional settings of the computer within the LabVIEW environment. To do so
1. | Open LabVIEW |
2. | Select Menu >> Tools >> Options |
3. | Select Front Panel in the ListBox |
4. | Deselect Use localized decimal point*
|
5. | Close LabVIEW |
6. | Open LabVIEW and run the Ophir Instrument VIs |
REMINDER: To work with LabVIEW, NI-VISA 4.6.2 or higher (from National Instruments) must also be installed.
Signals Timing of the Adapter have been Modified by Ophir - Please verify that your IEEE Adapter is marked v2.2 or higher (External Label)
For customers using the new LabVIEW COM Demo, there is nothing additional to do. Just open it and get started. If writing your own LabVIEW application, make sure that the OphirLMMeasurement COM Object is included in your LabVIEW application
For customers using the legacy OphInstr LabVIEW package, ensure that NI Visa 4.6.2 or higher (from National Instruments) is installed on the PC.
If your LabVIEW program is 64-bit, then you must run:
Surrogate64BitOphirCOMobject.reg
Close your LabVIEW application, run the above "reg" file, then run your application again.