Measuring Divergence of Custom Optical Fibers

This application note is intended to provide guidance for the measurement of the divergence angles of custom optical fibers. This also applies to other divergent sources such as laser diodes or LEDs. Measurement of the divergence of such sources can be made using either the Goniometric Radiometer or NanoScan family of products. The accuracy and detail of the measurement depends on the divergence and on the instrument used.

Author:

Jeffrey L. Guttman, PhD, Director of Technology, Ophir-Spiricon, LLC

In general, Goniometric Radiometers yield the most accurate measures, providing direct angular profiles with effective angular scan at constant radius with range up to ±72° for the LD 8900 and LD 8900R, and up to ±90° for the LD 8900HDR. They also provide a 3D spherical pinhole scan of the irradiance pattern.

The NanoScan measures the irradiance spatial profile using a scanning slit on a rotating drum. Angles are derived from the spatial data and the source position relative to the scan “plane”, actually an arc. Thus this is not a true goniometric scan, and there are errors that result due to the 1/r2 decrease in signal at increasing angle. There are also limitations due to the aperture/detector size, drum radius, and slit width, which effectively limits the useful angular FOV. Nevertheless, it does provide accurate divergence measures for “Gaussian” sources that are within this FOV, which is approximately ±30° for standard NanoScans with 9mm apertures and 5μm slits, and up to approximately ±45° for NanoScan LA models with 25mm or 13mm apertures and 25μm slits. For large divergence angles NanoScan LA systems are recommended because of the larger 25μm slit width and greater FOV.

The scan geometries for the Goniometric Radiometer and NanoScan are shown below:

Figure 2. NanoScan

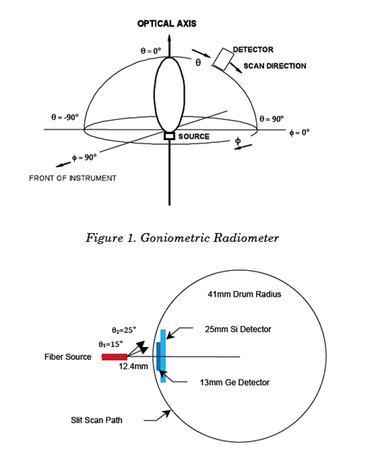
The Model LD 8900 and LD 8900/R Goniometric Radiometers scan at an internal radius of 82.7mm, with collection angle of 0.87°, angular sampling increment ~0.5°, and a maximum angular FOV of ±72°, for Aperture-Source Distance Das = 0. If Das is increased, that is the source is positioned away from the aperture, then both the angular sampling increment and the FOV both decrease.

With NanoScan the spatial sampling can be very small, down to fractions of microns. This gives high precision in derived divergence angles. However, again, the drum scan does not match the path of a goniometric scan. At extreme angles the slit of finite thickness will vignette and thus truncate the image. Also, the light travels much farther for the extreme rays.

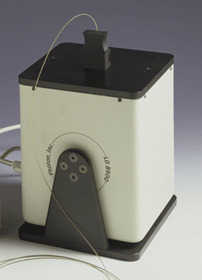
The NanoScan LA scanhead diagram shows the path for a slit aperture and the different photo detector sizes, 13mm Ge and 25mm Si. The dashed line shows the path of a goniometric scan, substantially different than that of the NanoScan. The diagram shows an extreme ray at 45° for an object placed at 3mm from the slit. An object placed 12.4mm from the drum can detect light from extreme rays only up to 25º. The limits to the FOV are due to vignetting by the slit aperture, and the 1/r2 reduction of signal amplitude. As the ray angle increases, these effects become more substantial.

To obtain accurate results one also needs to know the distance from the source to the scan plane. The position tolerance will be more critical for a source at 3mm versus 12 mm. It is for these reasons that Ophir-Spiricon recommends using the Goniometric Radiometer to measure highly divergent sources such as custom fibers.

Custom Optical Fiber Measurement

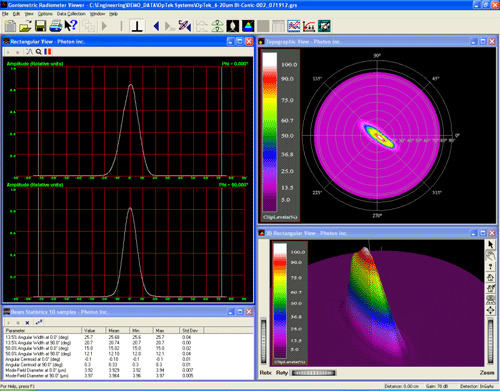
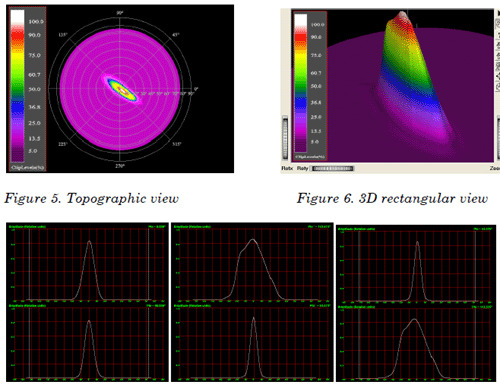
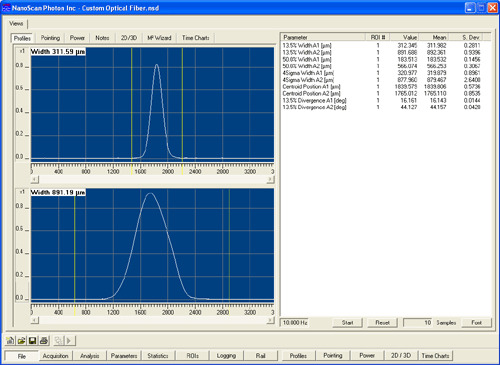
Measurements performed on bare fibers utilize the Bare Fiber Adapter Plate, shown below mounted on an LD 8900R. Typically, the orientation of the mounted fiber is random, so for custom elliptical configurations the direction of the principal major and minor axes is unknown. Thus the ϕ=0° and ϕ=90°scans of the Goniometric Radiometer will not capture the principal axis profiles. It is therefore necessary to do a 3D scan to obtain the principal axes profiles. This is shown in the GUI screenshot below. The direction of the principal axes is clearly seen from the 3D and Topographic View profiles. A powerful feature of the software is the Computed Cross Sections analysis, which generates profiles through arbitrary regions of the beam angular distribution. In this case, the profiles of interest are the principal axes of the distribution through the centroid. Once the direction of the axes is known, it is possible to set the azimuth scan angles to those directions so that profiles can be acquired in the Perpendicular Axes Mode, without the need to do a full 3D scan. The profiles for these three cases are shown below.

Figure 3. LD 8900R with Bare Fiber Adapter
Figure 4. Goniometric Radiometer software GUI showing custom fiber profiles.
Figure 5. Profiles at ϕ=0°, computed principal axes profiles; profiles at ϕ=53.325° and ϕ=143.325°

Measurements with NanoScan have the same issue with regard to the random fiber orientation. However, in this case the NanoScan must be manually rotated to align the scan axes with the principle axes. A screenshot of such a measurement is shown below. Observe the difference between the pinhole scans of the Goniometric Radiometer, which shows a non-Gaussian hump, and the slit scans of the NanoScan, where this profile structure is smoothed out.

Figure 6. NanoScan software GUI: Principal profiles by rotating scanhead.

Comparative Data

Six different custom fibers were measured using an LD 8900R Goniometric Radiometer and a NanoScan. The results for the 1/e2 divergence angles are summarized in Table 1.

The Goniometric Radiometer values are accurate. Significant errors are seen in the NanoScan values. The interesting result here is that some of the largest errors are in the minor axes data, where the profile angles are well within the “useful” FOV of the NanoScan. This is due to the non-Gaussian nature of those beam profiles. Thus, the measurements by NanoScan can be highly questionable for custom fibers, unless it is already known that the profiles are “well behaved,” such as for a single-mode fiber.

Table 1. Summary of custom fiber measurements using Goniometric Radiometer and NanoScan.

Conclusion

For characterizing highly divergent sources such as custom optical fibers, the Goniometric Radiometer is the instrument of choice.

Contact Us illustration

Have questions? Require assistance?

Click below to to contact Ophir Photonics and we'll get back with you shortly.

Contact Ophir Photonics