Case Study: Solving a Difficult Military Beam Alignment Task

The U.S. military often serves as the proving grounds for emerging technologies. With advances in laser technologies, it is more common today for these military systems to involve lasers. One such example is the use of a laser in the periscope of a nuclear-powered submarine. As you can imagine, the data that this laser provides relies directly on both the quality of the laser and its alignment within the system. So how is the accuracy of this particular system’s laser ensured?

Author:

Dick Rieley, East Coast Regional Sales Manager, Ophir Photonics Group

Providing instrumentation on-board a 6800 ton submarine that ensures true and accurate pitch, yaw, and roll data is essential. Laser based systems are required to achieve this level of accuracy under conditions where GPS data and the influence of gravity relative to the alignment and orientation of the vehicle are the limited inputs. As a result of the critical nature of this information, the burden is then placed on the quality of the laser beam, its size, its shape, and its intensity.

Which Measurement Method

The data collected from the measurement of these lasers must be the most accurate that the industry can supply. To supply this data, Ophir-Spiricon BeamGage® beam diagnostic software was used along with the Spiricon SP300, a high-speed, high-resolution USB3 CCD camera. It offers a high resolution array, 7.1 x 5.3 mm, and pixel spacing of 3.69 x 3.69 um. An active area of 1928 x 1448 pixels was used.

The challenge of this beam measurement application was the identification and location of the center of a large area laser alignment beam, <30 mm. Due to the size of the beam and the >30 M distance to the target plane, the application did not lend itself to locating an exacting position and alignment of the beam. Several attempts at this alignment using IR sensitive sensors and materials did not prove sufficient to the accurate positioning of the beam. The solution was eventually obtained through the use of the Spiricon SP300, large area USB CCD camera, operating with BeamGage Professional software.

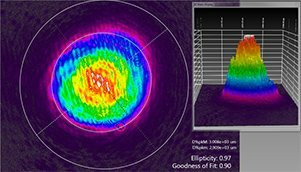
Figure 1. 2D & 3D Beam Profiles of Laser’s Raw Beam Ellipticity: 97% | Gaussian Goodness of Fit: 90%

Three key measurements were made: 1) a baseline measurement of the source beam using the 1/e2 measurement value, 2) a measurement calculation of the beam’s ellipticity (roundness), and 3) a calculation as to the laser source’s Gaussian, or Goodness of Fit value.

The analysis of this laser source was first conducted with the SP300 camera positioned at 1m from the source, without optics, splitters, or other optical interference between the source and the CCD array. The camera was only installed with an ND2 attenuator to avoid the camera saturating, a condition that can, if allowed to persist, damage the array and produce meaningless measurement values.

Critical Measurements on the Raw Beam

The first beam analysis was conducted on the raw beam from the laser source to establish a baseline of the size and shape of the beam, the orientation of the beam (round or oval), and, if oval, the direction of the minor and major axis positions. Due to the critical nature of the quality of the laser source, having a beam that possesses an ellipticity value of 92% or better is essential (a perfectly round beam has an ellipticity of 100%). Most high quality laser sources demonstrate an ellipticity value of 90% or better. In most high reliability applications, any measurement that is within 10% of an absolutely perfectly round beam meets specification.

The beam size, measured using the 1/e2 (13.5% of Peak) technique as specified by the manufacturer of the source, was validated by the BeamGage measurement when imaged at a short distance from the source. The overall shape of the beam and the distribution of the intensity internal to the beam was another issue that had yet to be diagnosed.

Once the overall beam size had been validated and determined to be within specification, the next analysis required the measurement of the ellipticity (or roundness) of the beam. BeamGage Professional software offers this quantitative measurement and graphic validation of this condition by activating the ellipticity measurement, which is a ratio of the major and minor axes. The quantitative measurement of ellipticity was determined to be 97%. Figure 1 shows the major crosshair (from lower left to upper right) and the minor crosshair (from lower right to upper left). The actual difference in the beam diameter measurement vs the same measurement when the ellipticity measurement is activated is only a difference of 197um.

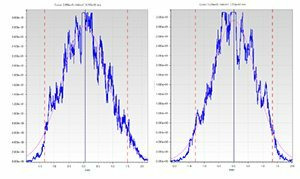
was to obtain both the quantitative value for Gaussian Fit (Goodness of Fit) as well as obtain a graphic representation of the actual measurement of the laser source. In this case, the goodness of fit was calculated to be 0.90, which is a value most applications would accept. However, in high reliability applications such as this one, the 0.90 may not be sufficient – but that had yet to be determined. The important result of this measurement is that it allows engineering to make adjustments to the beam based on quantitative results, not based on an interpretation or opinion of an image.

Critical Measurements at a Distance

The last procedure in the analysis of the laser source involved repeating these measurements when the beam profiling system is positioned at greater distances from the source. This allows for determination of which of these measurements change, the degree of change, and if those changes are within tolerance.

Two additional sets of measurements were initially taken, each at an increased distance from the source. The purpose was to determine changes in beam diameter, ellipticity values, and Goodness of Fit values.

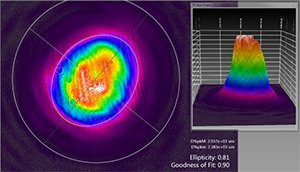
At this intermediate position, change had occurred; the beam size had increased by 5%, which means that the beam had some divergence present. Also, the ellipticity had deteriorated by 16% while the goodness of fit remained largely unchanged.

What Was Learned

The important aspect of these measurements for this application and the technical staff involved in qualifying the laser source is the opportunity to not only see the graphical difference from beam profiling at different distances from the source, but, more importantly, to capture the quantitative differences. These values allow for adjustment and improved efforts on the source. They also determine, by the numbers, the impact on the over project. Only through the use of the beam profiling software were the engineers able to capture these key measurements and images. With them, the technical staff can begin to identify the variables within the laser source and its final assembly to ensure the overall performance of this complex system meets the rigorous specification of the application.

Contact Us illustration

Have questions? Require assistance?

Click below to to contact Ophir Photonics and we'll get back with you shortly.

Contact Ophir Photonics