Measuring Laser Position & Pointing Stability
One of the laser’s most useful properties is that it can propagate over great distances defining a straight line, and many optical systems are designed to exploit this property. Therefore, beam profilers are often used to verify the performance of lasers and optical systems to avoid problems caused by bad alignment or to streamline the manufacturing processes of these devices. This is often a simple measurement of where in space a laser spot is focused or aimed, which is relevant to a number of laser applications from laser range finding to optical scanning, laser marking to building laser printers. Beam profilers have the capacity to tell where the beam is located on the detector, and different types of profilers can do this with varying degrees of accuracy and precision. Most of the time the measurement is made by placing the beam profiler at some distance from the laser source and aligning the beam until it points to the ideal target. For laser scanning applications the measurement may be made in different locations across the scan plane to ensure proper linearity of the scan. But there is more to this measurement and more that can be learned about the laser’s performance.
Author:
Allen Cary, Director of Marketing, Ophir-Spiricon
Laser pointing accuracy and pointing stability are defined as an angular value, usually in milli- or microradians (mr or μr). Pointing accuracy is simply whether the laser points where it is supposed to. Pointing stability is a measure of how much the beam position drifts from the ideal target over time. Stability can be affected by a number of factors, internal and external to the laser itself, including physical motion, heat buildup, cavity instability, air currents, and many more.
There are actually two components to laser pointing and laser pointing stability, linear and angular, which combine to affect the beam’s position. The linear component comes from the horizontal and vertical motion of the laser, perpendicular to the axis of propagation. Call this X and Y. This is the motion that one sees when the laser is raised or lowered, translated right or left, or is subjected to some type of vibration. This motion is normally 1:1, that is, if the laser is raised 1mm, the spot moves 1mm unless there is a magnification lens in the optical path¹.
The angular component is the tip or tilt of the laser beam altering the path from the parallel. We call this dθx or dθy. It is possible to design a fairly simple measurement system to separate these two components of pointing. This can be very useful if the measurement’s purpose is to determine the stability of pointing in an optical system. It is good to know whether instability is coming from linear motion of the laser or from angular perturbations.
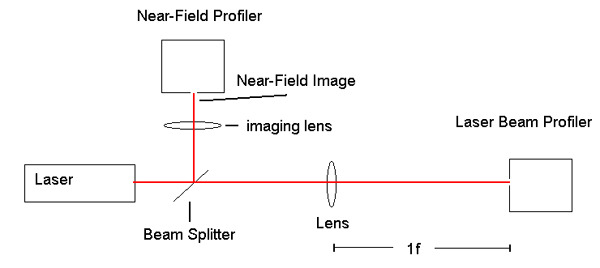
In order to measure the linear and angular pointing, the measurement system will comprise two detectors. The first is set up as a near field profiler imaging the front aperture of the laser via a beam splitter. The other detector in the far field is set up with a lens of a known focal length (e.g., 1 meter) with the detector positioned at the geometric focus. With this system any linear motion of the laser will be detected by the near field profiler, but will not appear in the far field due to the f-theta properties of the lens. Angular changes, on the other hand, will be detected by the laser beam profiler.
The above-described apparatus performs a fairly specialized test. Most people are simply interested in the location of a beam at a certain distance or the pointing accuracy along the axis of propagation. Very accurate beam position measurement is much more difficult that it first appears, because the beam can be affected by air currents or heat waves, which can change the refractive index of the air through which the beam is propagating.
The NanoScan Advantage
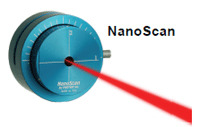
The pointing accuracy of Ophir’s NanoScan allows the entire measurement to be reduced to the bench top. Using scan averaging, the NanoScan can measure pointing to <100nm, which translates to the ability to measure deviations of < 1μr on a 10cm test bench. ² With this level of resolution very accurate pointing measurements can be accomplished in a small space and with little opportunity for external forces to impact the measurement. Obviously a 10cm test range is far easier to manage and control than one spanning 100 or even 1000m in length. Manufacturers of range finding and laser sighting products have found that the NanoScan reduces their test time dramatically, leading to high throughput and rapid time to market for their products.
Measuring the pointing stability of the laser is facilitated in the NanoScan software by use of time statistics and accumulates features of the parameters and pointing windows. The pointing window accumulate mode provides a picture of the amount of excursion seen and in which axes the movement takes place. The time statistics graphs provide a temporal picture of any instability, e.g., does instability coincide with another event, such as air conditioning or equipment start-up, beginning of swing shift, etc? These tools can help get a more complete picture of the sources of instability and provide information to improve the laser system.
Other Measurement Solutions
Position detectors, such as quad cells and PSDs (position sensitive detectors), have numerous shortcomings. Although quad cells can tell if the beam is centered on the detector, it doesn’t easily tell the actual positional error if the beam is not centered. For small beams (<200μm) they are essentially useless, because the inter-cell gap is 100μm. PSDs are better; they have accuracies on the order of 0.1%, but are only capable of handling laser powers of a few milliwatts. They are very fast, analog devices, but all they can do is measure position. If a precise measurement of small changes is required, it may be necessary to make the measurement over a long distance. This long distance has several disadvantages, most obviously the requirement for a large space in which to perform the measurement, but also the long distance range provides ample opportunity for the external influences of air currents and heat waves to alter the beam.
Cameras
Of course it is possible to make these measurements with a camera-based profiler, too. There will be some compromises required due to the need for attenuation and the lower absolute pointing accuracy of the camera systems. Attenuators will alter the beam path, and it will be necessary to make corrections for these if accurate results are to be obtained. The rule of thumb for pointing accuracy in a camera array itself is approximately one-tenth pixel; therefore with the current state-of-theart CCD camera sensors the accuracy will be 0.4 to 0.6μm. Despite these shortcomings, for low repetition rate pulsed lasers in the visible to near IR wavelength range, this is the only good solution.
Ophir has a number of cameras, which combined with the BeamGage software can make beam stability measurements either with strip charts measuring beam drift over time, or with a histogram measuring the spatial drift.
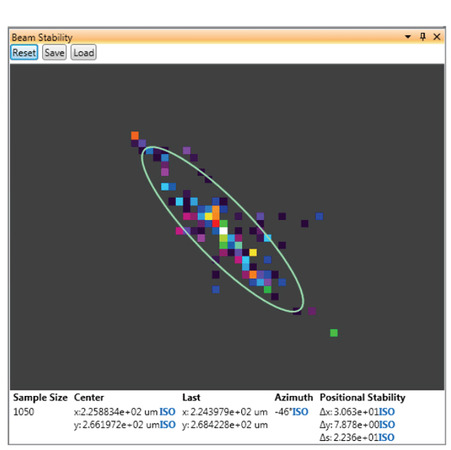
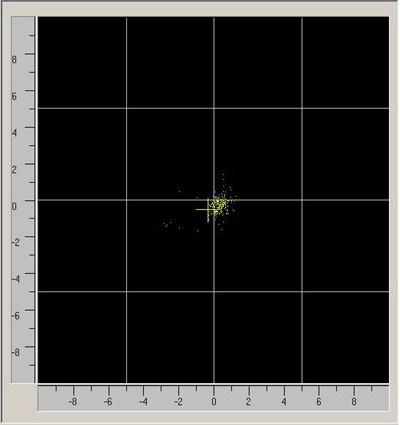
The above results tell the mathematical movements of the centroid histogram. These are ISO defined3 calculations and the above information is as follows:
- Sample Size is the total number of data points in the histogram. A minimum of 1000 samples is required to satisfy the ISO requirement for the results items.
- Center is the coordinate position of the centroid of the histogram.
- Last is the coordinate of the last centroid plotted.
- Azimuth Angle is the angular direction of movement.
- Positional Stability is the computed 4σ of the displacement in the axis of the beam distribution Azimuth Angle where Δx, Δy and Δs are the positional results along the direction the azimuth angle, orthogonal to the axis of the azimuth, and radially when the distribution of the motion is random and lacks a clearly definable Azimuth direction.
- The displayed aperture (Lt Green) is a graphical plot of the Azimuth, Δx, and Δy results plotted superimposed over the histogram distributi
Conclusion
There are many ways to measure laser pointing stability depending on the type of laser to be measured, the level of accuracy required, and the speed and ease of the measurement technique desired. Ophir Photonics can provide many of these systems and the expertise necessary to match a system to your requirements. In any case a measurement system will provide a quantifiable value for your pointing stability measurements. You will know if your laser system is performing as designed and be able to make corrections if it is not.
- This method can be used to calibrate a magnification system by moving the laser a known distance and comparing the motion at the detector. At a nominal 10:1 magnification one would expect 100μm motion of the laser to appear as 1mm at the detector; if it is 955μm, then we know that the actual magnification is 9.55:1.
- S.C. Irick, W.R. McKinney, D. Peterman, V.V.Yashchuk, “Performance of Long Trace Profiler Part 5.1: Noise Due to Laser Pointing Instability” Light Source Notes, October, 2005
- ISO 11670:2003 : Lasers and laser-related equipment -- Test methods for laser beam parameters – Beam positional stability