Instantaneous Measurement of M² Beam Propagation Ratio in Real-Time

A new instrument design allows the M² beam propagation ratio to be measured in real time at the update rate of a standard CCD camera. This allows lasers from single shot to CW to be measured while the laser cavities are being adjusted. This drastically reduces the test time required for this operation. In this paper we will discuss the theory behind this innovative approach to the M² measurement and the methods for the selection of the proper optical components for use of the system with various laser types and beam shapes. The authors will show results of numerous measurements of different lasers and laser types, including solid state diode, fiber and traditional gas lasers with M² values from near 1 to considerably higher values, and show comparisons these results with other measurement methods.

Author:

Allen M. Cary, Jeffrey L. Guttman, Razvan Chirita, Derrick W. Peterman, Photon Inc

The instrument design is based on a method of simultaneous capture of the waist and several Rayleigh ranges, allowing the instantaneous fit of the ISO M² propagation curve. The authors will discuss the important considerations necessary to generate accurate results for different laser configurations.

Introduction

The M² propagation ratio has become the principle measurement of laser beam quality used by both laser manufacturers and laser users to ensure the performance of their lasers. There are several recognized methods of determining this value, but until recently it has always involved making a number of measurements along the axis of laser beam propagation and consequently has required a relatively extended time for these measurements. This has effectively precluded the M² measurement of lasers with single shot or very low repetition rates. It has also prevented the measurement of the variation of M² in lasers that may not have a stable propagation or the real-time observation of the effects of cavity adjustments on the propagation factor. The instrument that we will describe in this paper makes instantaneous M² measurements that allow all of the above. By capturing the entire caustic in one camera frame, the M² value can be determined for each data acquisition, allowing single shot beams to be measured or real-time adjustments to continuous wave or pulsed lasers of any frequency to be observed.

The M² propagation factor is defined according to the following formula:

which when rearranged, demonstrates the significance of the value.

The ability to focus the laser beam to the smallest waist size, or diffraction limited spot size, is a function of M² times the wavelength constant 4λ/π and the divergence angle θ. When the M² value approaches 1, then only the wavelength and divergence angle affect this waist size. For this reason many laser makers strive to build lasers and laser systems with M² value as close to 1 as possible. M² has thus become a specification of laser quality.

The ability to make real-time measurements of this parameter provides the fastest possible measurement and allows for the measurement of a single beam pulse in low repetition rate lasers and even some high repetition rate lasers with rates to 50kHz.¹

We will show the results of this new measurement technique for a number of lasers and compare these results, where possible, with those obtained by other recognized methods and instruments.

Description of Instrument and Method

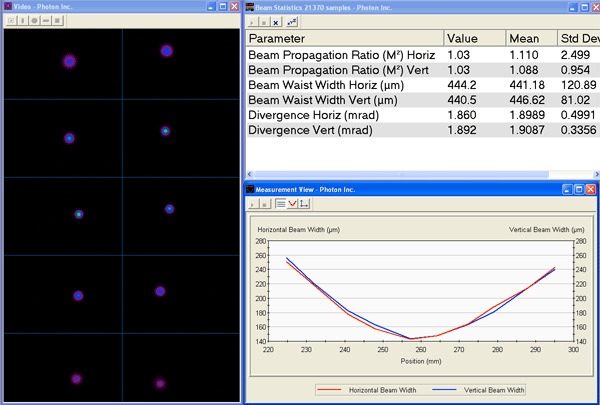
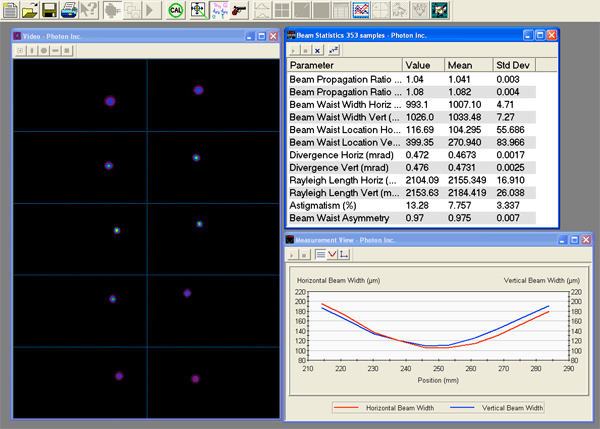
The instrument that we will describe uses a patented method to focus the entire caustic of the beam on a CCD camera at once. Ten reflective surfaces created by five uncoated quartz plates are positioned to reflect ten beams onto the camera chip. With the proper selection and positioning of a test lens, ten beam profiles from the waist region and several Rayleigh ranges either side of the waist are focused on ten defined regions of the camera chip. These beam profiles are analyzed simultaneously and a fit of the beam caustic is made to the M² curve. The M² is calculated for each frame captured on the camera, providing a real-time analysis of the M² value. In addition other ISO parameters of the beam propagation are also reported, including beam waist size and location, Rayleigh range and beam divergence angle.

Figure 1. ModeScan 1780 instrument display showing the ten beam spots, M² fit curves for major and minor axes and the propagation parameters

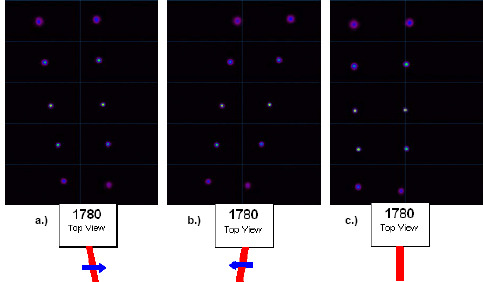
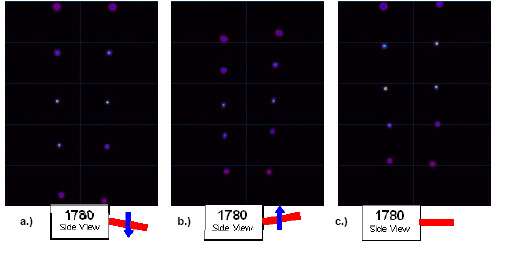
Although the alignment of the instrument might appear to be difficult, it is not. If the laser beam enters the instrument on plane, which can be easily accomplished using a pair of steering mirrors, or front-surface reflections, if attenuation is desired, the fine adjustment is easily accomplished. Vertical adjustment of the beam from the steering mirrors will adjust the vertical spacing of the ten beam profiles; horizontal adjustment will adjust the right and left skew. Moving the instrument itself, will adjust the simple right-left and up-down alignment.

Figure 2. Video views showing initial coarse alignment: a.) is with input beam skewed left b.) is with input beam skewed right c.) shows proper vertical alignment. The blue arrow indicates the direction to repoint the laser beam to correct the skew.
Figure 3. Video view showing a.) expanded vertical separation, b.) reduced vertical separation and c.) proper separation where the spots are spaced nominally at the horizontal grid spacing. The blue arrow indicates the direction to repoint the laser beam to correct the vertical separation

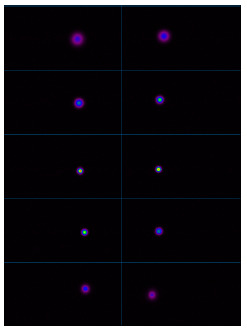
The final alignment is then accomplished with the fine horizontal and vertical adjustment of the gimbal mount of the instrument, resulting in the following:

Figure 4. Video view showing the 10 spots properly positioned to be in the 10 respective regions of analysis of the CCD camera.

As soon as the beams are in the ten regions of analysis, the M² and other propagation parameters are calculated and displayed.

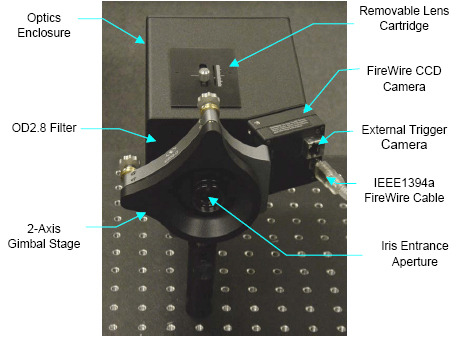
Figure 5. ModeScan 1780 Instrument

Considerations for Measurement

In order to make meaningful measurements with the ModeScan1780, it is necessary to focus the waist and caustic of the beam onto the CCD. There are three variables, dictated by the laser parameters, that need to be considered in the proper set up of the experiment. They are the lens focal length, laserto- lens distance, and laser-to-instrument distance

.

There are some lasers that cannot be measured, but the vast majority that we have tried have a combination of the above variables that will result in reasonable and consistent answers. In order to make the determination of the proper lens configuration simpler, we have generated an algorithm and spreadsheet to assist in the calculations.

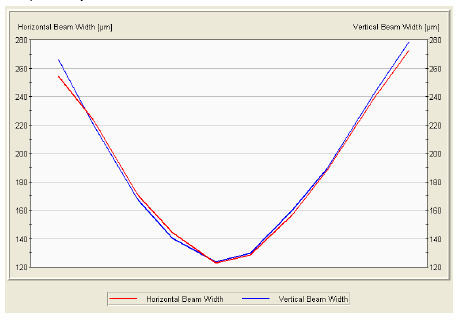
Figure 6. Display of the M² Fit curve showing the proper depth

The 10 sampled beam positions in the ModeScan 1780 span a fixed optical distance of approximately 7.2cm. The “optimal” measurement configuration takes this span into account together with the dynamic range of the CCD camera and considerations of beam measurement accuracy to determine an optimal Rayleigh range in the test space. This yields data for beam diameter that is accurate, and ensures accuracy in the propagation caustic hyperbolic fit.

In practice, the system attenuation and/or gain and exposure settings are set to yield near full-scale values for peak profile signal for the measurements near the beam waist. For the 12-bit data acquisition, this full-scale value is approximately 4000 counts. The 2% accuracy specification is valid down to measured peak signal value of approximately 400counts, and this determines the range for optimal measurement. This equates to a beam diameter approximately 3.16d0, where d0 is the waist diameter, and this translates to a measurement that is 3 Rayleigh ranges from the waist. This gives ZR = 1.2cm. This is the smallest acceptable Rayleigh range that assures the 2% accuracy. For fit accuracy it is also desirable to have some data at least 2 Rayleigh ranges from the waist, and this corresponds to a beam diameter of 2.24d0, and gives ZR = 1.8cm. This is the largest acceptable range for measurement accuracy. In conclusion, the specified accuracy is achieved when the Rayleigh range in the test space is 1.2 –1.8 cm. These will then yield sufficient depth to the fit curve to result in a good M² value that agrees with results from other recognized methods.²

Examples of Results from Various Lasers

We have tested a number of lasers with the ModeScan 1780 system and compared them with the results obtained from other M² techniques. In those cases where this technique is feasible (i.e., the proper test area parameters are obtainable) the results compare quite favorably with those for lasers with a wide range of M² values.

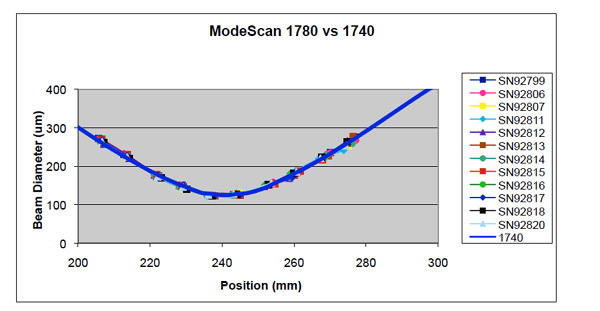
Figure 7. Comparison of Beam width results from the NIST-traceable NanoModeScan linear motion stage mounted slit scanning profiler and 12 ModeScan 1780 instruments showing agreement of measurement technique
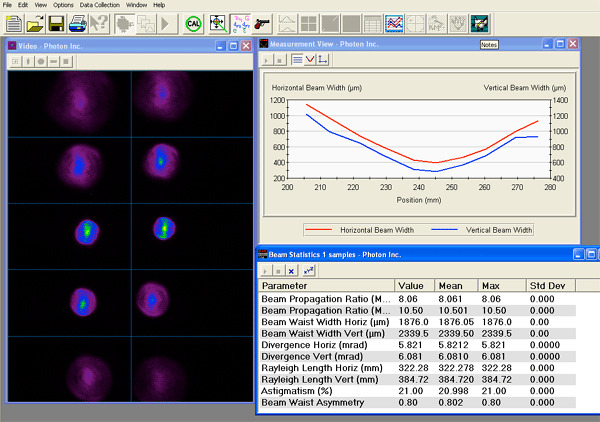
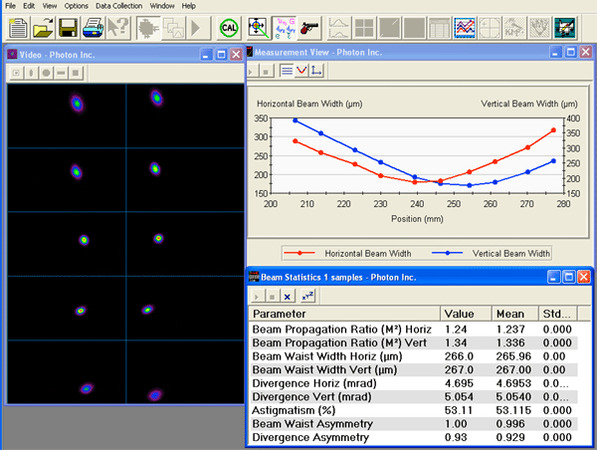
Figure 8. Display of M² measurement of a 355nm solid state laser with near 1 propagation factor.

Lasers with higher order propagation and larger M² values yield results consistent with other methods as with this Nd:YAG laser:

Figure 9. Display of measurement of high power lamp-pumped Nd:YAG marking laser, operating at 1064nm
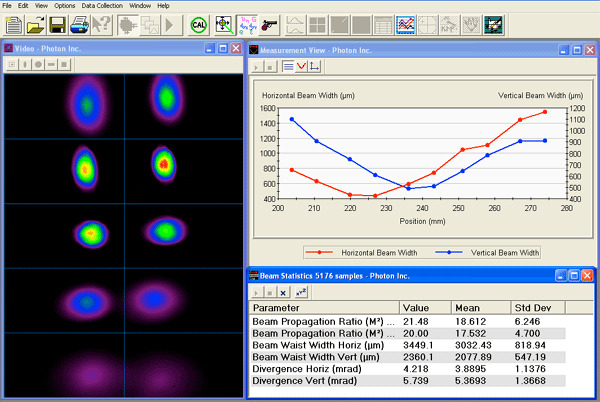
Figure 10. Lamp-pumped Nd:YAG laser operating at 532nm, showing increased M² values

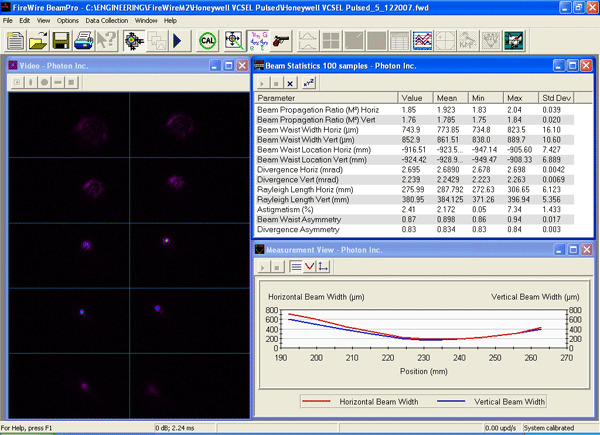
Femto-second lasers are also easily measured using this technique as can be seen from this example of a Ti:Sapphire laser operating at 743nm wavelength:

Figure 11. M² measurement of Ti:Sapphire femtosecond laser operating at 743nm and ~80MHz repetition rate

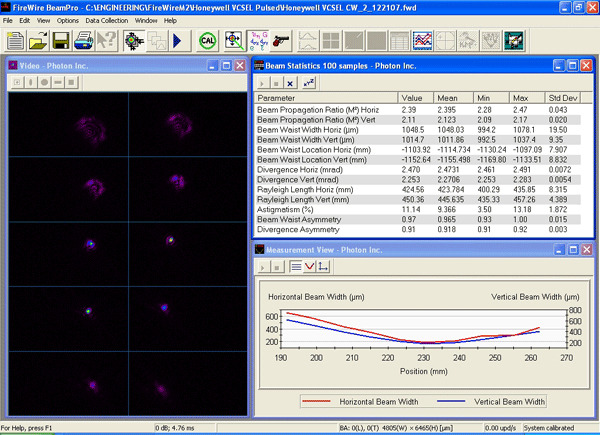
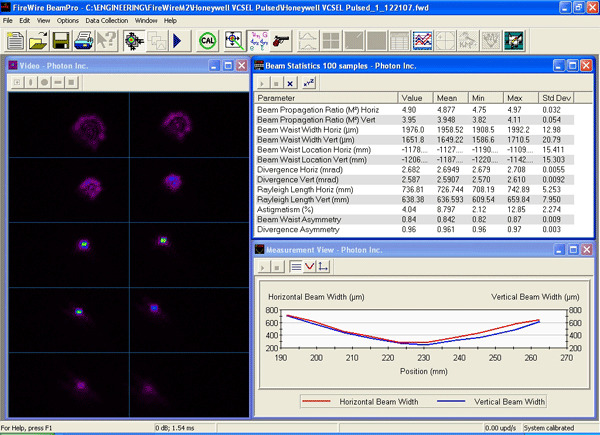
The real power of this technique is the ability to see the effects of adjustments to lasers and laser systems in real-time. The following three displays show a VCSEL operated in CW mode with a change to input current. The third display shows the effect of operating the VCSEL in a slow-pulsed mode (~20Hz).

Figure 12. VCSEL at 780nm showing the effect on M² of increasing the drive current in CW mode. Top) 2.5mA Bottom) 4.6mA
Figure 13. Effect of pulsed operation on the M² value for VCSEL; pulse parameters: 20Hz, 5msec pulse width, 8mA peak power.

Conclusion

This novel instrument technique provides the laser engineer with a new tool for the measurement of the M² beam propagation ratio. It makes possible the measurement of some lasers that heretofore were impossible to measure and allows real-time tracking of the results of optical adjustments on the propagation of laser beams. In addition, it increases the speed of this analysis for all types of lasers. Its compact size and lack of moving parts make it convenient for field service and other mobile operations.

¹ This will be dependent on the wavelength of the lasers. NIR beam pulses near 1000nm and above cannot be isolated using the camera’s shutter. ² Other methods for determining M² include the ISO Method employed by the Photon ModeScan 1740 and the Rayleigh Method
Contact Us illustration

Have questions? Require assistance?

Click below to to contact Ophir Photonics and we'll get back with you shortly.

Contact Ophir Photonics