Automated Measurement of VCSEL Power at 10 kHz Using Centauri and LabVIEW

Ophir's Centauri display can be used to log and analyze measurements at 10KHz either as a standalone meter, or using the StarLab PC software application. In this paper we explain how the Centauri display can be used in an automated environment to measure power at 10KHz using a simple LabVIEW application. This setup can be used for LIV characterization in either CW or pulsed operation. This type of application make use of the COM object (DLL) which enables direct control of Ophir's meters over software platforms such as C# or LabVIEW.

Author:

Efi Rotem, Daniel Sebbag

Ophir's new IS1.5-VIS-FPD800 offers several advantages for measuring VCSEL's in a single instrument:

A precision photodiode for calibrated average power measurement A fast photodiode for pulse shape characterization on an oscilloscope An SMA fiber optic adapter for easy connection to a spectrometer
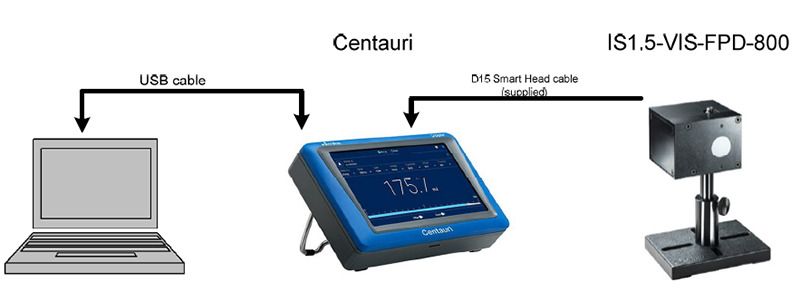
Figure 1. Setup

System setup

The IS1.5-VIS-FPD-800 is connected to the Centauri laser power and energy meter using the built in D15 Smart Head cable.. The Centauri display is connected to the PC using a USB cable. The PC is running LabVIEW and the Ophir COM object is installed.

The COM object supplied by Ophir is easy to use and allows access to all of the display's functions. The LabVIEW application shown here is a simple example of how to use the Centauri to capture power measurement at 10KHz in an automated environment.

Running the LabVIEW example

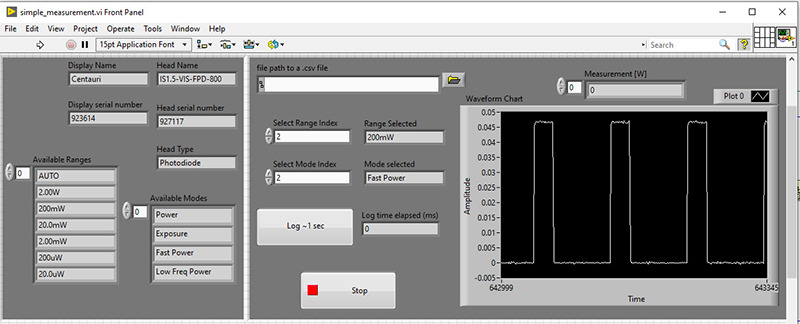
After clicking the run button, the meter and sensor details will appear in the top left. The range and measurement mode are selected in the bottom left. 'Fast Power' should be selected for high speed power measurement at 10 kHz.

Figure 2 is snapshot of the LabVIEW application showing power measurement of a VCSEL pulsing at 100Hz.

Figure 2. High speed power measurement of pulsed VCSEL at 100Hz

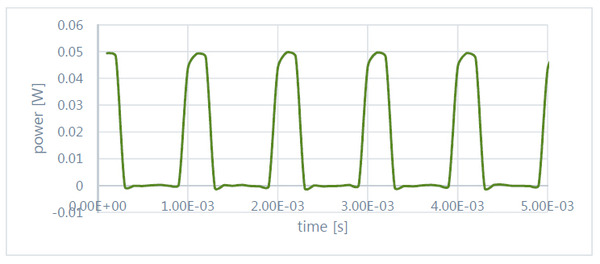
Next, press the 'log – 1 sec' button to acquire 1 sec of power measurement data samples at 10 kHz. The data is stored as a 1D array and will be saved as a .csv file. Figure 3 shows the power measurement of a VCSEL pulsing at 1KHz obtained via the LabVIEW application.

Figure 3. High speed power measurement of pulsed VCSEL at 1 kHz

Conclusion

High sample rate power measurement in an automated environment is made simple using Ophir's COM object.

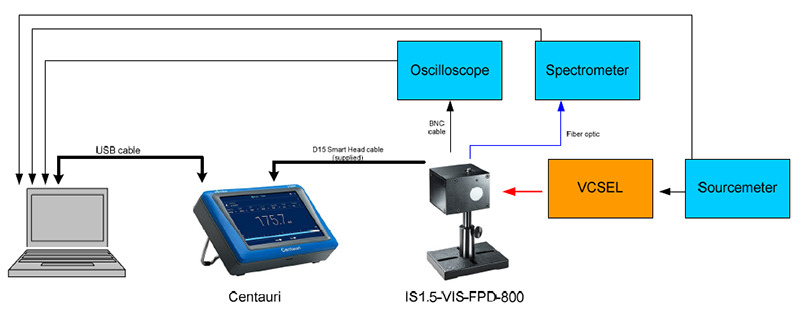
The LabVIEW application shown here is available for developers in (Simple Measurement.vi). A complete VCSEL characterization system built around the IS1.5-VIS-FPD-800 is shown in figure 4. The LabVIEW application presented in this article can be integrated into such a system.

Figure 4. Schematic
Contact Us illustration

Have questions? Require assistance?

Click below to to contact Ophir Photonics and we'll get back with you shortly.

Contact Ophir Photonics