Multi-Functional Integrating Sphere for VCSEL Measurements

Ophir's new IS1.5-VIS-FPD-800 is a multi-functional sensor that offers several advantages in a single instrument for measuring VCSEL's:

  • A precision photodiode for calibrated average power measurement
  • A fast photodiode for pulse shape characterization on an oscilloscope
  • An SMA fiber optic adapter for easy connection to a spectrometer

Author:

Efi Rotem, Shimon Elstein, Daniel Sebbag

A complete VCSEL characterization system built around the IS1.5-VIS-FPD-800 is shown in figure 1.

Figure 1. Schematic diagram of a complete VCSEL characterization system build around the IS1.5-VIS-FPD-800

In this paper we will discuss how to use the IS1.5-VIS-FPD-800 for VCSEL characterization in both CW and pulsed operation modes.

Connections

  1. A 12V power supply is included. . It provides the bias voltage required for proper operation of the fast photodiode.
  2. The attached cable with D15 connects to an Ophir meter such Centauri or an Ophir PC interface such as Juno.
  3. The fast photodiode analog output is supplied to the BNC connector on the housing. This should be connected with a 50Ω coaxial cable to an oscilloscope with 50Ω input coupling.
  4. An SMA connector is provided on the housing for attachment of a fiber optic cable. This is used for sampling the optical signal with a spectrometer. Approximated throughput factor from the input port to the core of the fiber optic cable is: 1400D²xNA²

Where D is the fiber diameter in meters, and NA is the numerical aperture. For example, a standard 200μm / 0.22NA has a throughput of 2.7*10⁻⁶.

Working distance and field of view

The IS1.5-VIS-FPD-800 has a 20 mm diameter input port. For a small source (≤ 2mm) located flush at the input port, the angular acceptance is 120°, full angle. Light at larger angles will enter the sphere, but may not be measured accurately.

The angular field of view depends on the size of the light source and its distance from the input port. As seen in the picture below, on the left the VCSEL is sufficiently close to the integrating sphere such that all the power is measured properly, while on the right some of the beam is left out.

Figure 2. Field of view

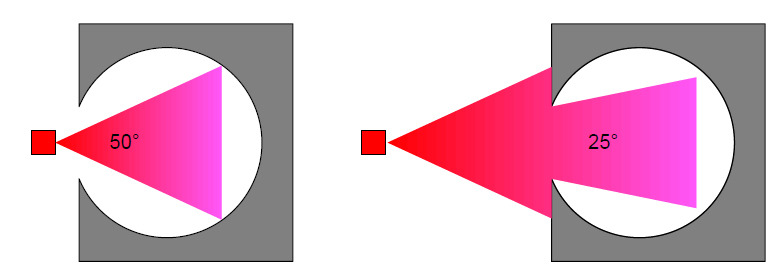
When working very close to the sphere's input port, the size of the emitter is the determining factor in defining the field of view. the following table gives the field of view as a function of the emitter size when the emitter is right at the sphere input:

Emitter size <2 mm 4 mm 10 mm
Field of view (full angle) 120° 90° 80°

When the source is located at a distance from the input port aperture, both the source size and the distance will influence the field of view.

The following table gives the FOV for a small source at different distances:

Distance  10 mm  20 mm  30 mm  40 mm 
Field of view (full angle)  90°  53°  37°  28°

If the source size is not small, the maximum distance allowable can be calculated from this table using simple geometry.

CW testing

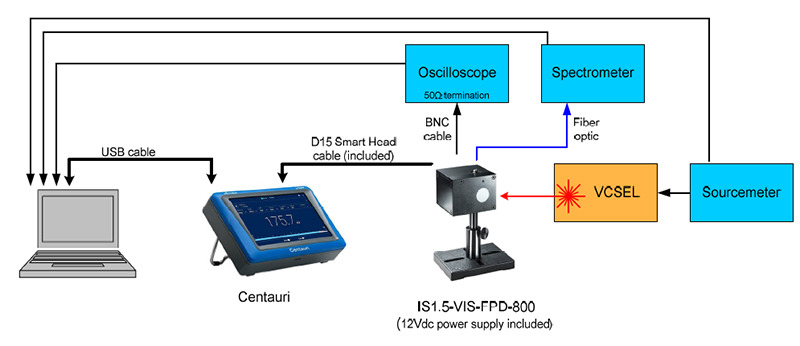
In CW, the VCSEL is emitting a fixed power into the sphere. The IS1.5 provides calibrated absolute power measurement through the D15 smart head cable attached to it. The power measurement can be read using any of Ophir's displays such as Centauri and PC interface such as Juno, Juno+ or EA- 1Ethernet adapter.

Pulsed operation testing - Average power

The first question one may ask is, can I trust the calibrated photodiode to measure average power when the VCSEL is operated in pulsed mode. Well, as long as the average power and pulse energies do not exceed the specified values, the answer is yes. The linearity and accuracy of the calibrated photodiode was tested at 50ns pulse width and 100KHz repetition rate. The linearity was better than ±1% up to 1.8W average power.

In fact, pulse rates higher than 200Hz appear as CW for the calibrated photodiode. When the repetition rate is lower than 200Hz, the 'Low Frequency' mode should be selected on the meter. This mode will eliminate any measurement instability that might be caused then the meter sample rate and the laser repetition rate are too close. (Note: The "Low Frequency" mode only allows for frequency settings up to 100 Hz. For frequencies between 100 Hz and 200 Hz, a value equal to half of the actual frequency should be used for the setting.)

Ophir's Centauri display can be used to log and analyze measurements at 10KHz either as a standalone meter, or using the StarLab PC software application. In a different paper we show how the Centauri display can be used in an automated environment to measure power at 10KHz using a simple LabVIEW application. When working with pulses in the millisecond range, that might be sufficient for characterizing the pulse shape as well. For reliable measurement when using the 10 kHz measurement rate, the signal's frequency and duty cycle should be considered. A square wave, for example, should have both low and high level periods of at least 500 μsec in order to be properly sampled.

Pulse visualization using the fast photodiode

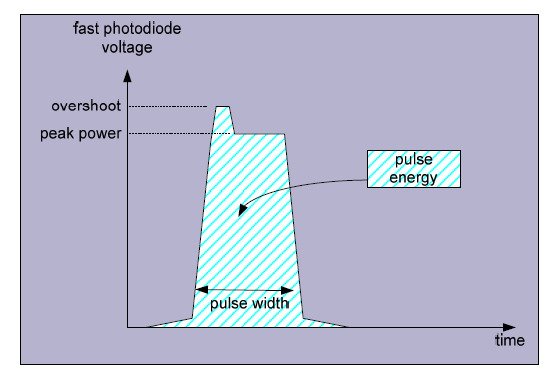
For higher repetition rates, the fast photodiode can be used to visualize the temporal shape of the pulses and provide some important information. The fast photodiode is accessed via the BNC connector on the IS1.5. It is usually connected to a scope and should be terminated with a 50Ω load.

Figure 3. Pulse characterization

Several important parameters such as pulse width, peak power, pulse energy, pulse to pulse variation, overshoot and undershoot can be measured.

In order to make absolute measurements using the fast photodiode, its responsivity must be determined first. The best way to do that is to drive the VCSEL in CW. Dividing the voltage measured by the fast photodiode by the power measured by the calibrated photodiode will give you the responsivity of the fast photodiode in [V/W]. From that point it is possible to look at the signal from the fast photodiode as a calibrated power measurement. This can provide accurate measurements of the peak power of the pulse and distortions such as overshoot or undershoot.

Pulse energy can also be measured by either integration of the area under the pulse or simply by dividing the average power by the repetition rate. The later method is accurate only if no power is emitted between pulses.

The linearity of the fast photodiode for measuring power and energy was tested with short pulses at 60ns pulse width and 50 kHz & 100 kHz repetition rate and was found have linearity better than ±1% up to 1.8W average power and up to 600W peak power.

Contact Us illustration

Have questions? Require assistance?

Click below to to contact Ophir Photonics and we'll get back with you shortly.

Contact Ophir Photonics