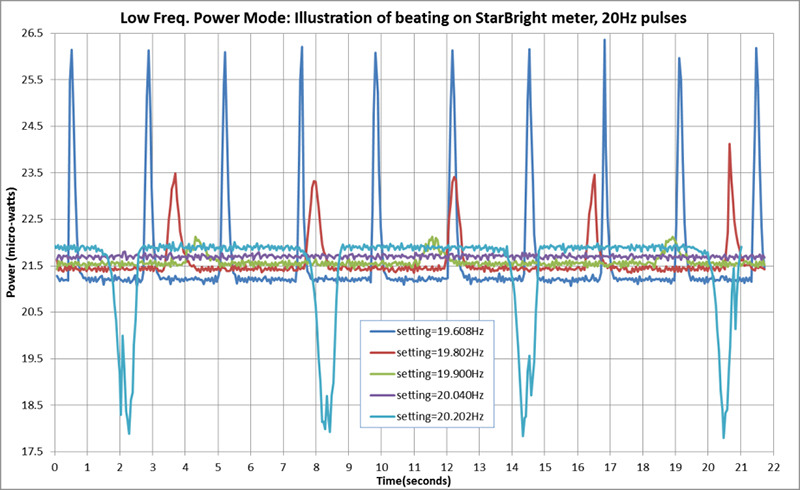
Sometimes, if the laser pulse frequency does not quite match the sampling time being used by the software, beating effects can happen. This will manifest itself by periodic changes in the measurement, sometimes over a period of several seconds or 10’s of seconds. If the frequency setting is too low, this may result in periodic positive “spikes” of power above the average power level being measured. If the frequency is too high, the spikes will be negative, below the average power level. As the frequency is adjusted closer to the correct laser frequency, the spikes will become smaller and further apart, until they disappear altogether when the frequency is adjusted perfectly. Note that due to slight errors in the nominal internal clock frequency of the measurement device, or of the laser pulse frequency, the exact frequency setting required for perfect measurements may not be exactly as expected.
In the illustration above (Figure 2), the exact frequency of the pulses appears to be 20.04Hz. Setting a frequency slightly above or below this value gives rise to spikes of power readings above or below the nominal average power. In addition, the nominal average power level (the flat sections between the spikes) appears to vary slightly with the frequency setting. The reason for this is that the overall average power (including the spikes) is constant in all cases, but the positive spikes are “offset” by a slight lowering of the “floor” level of the measurements, so that together they average out to the same average value in all cases.
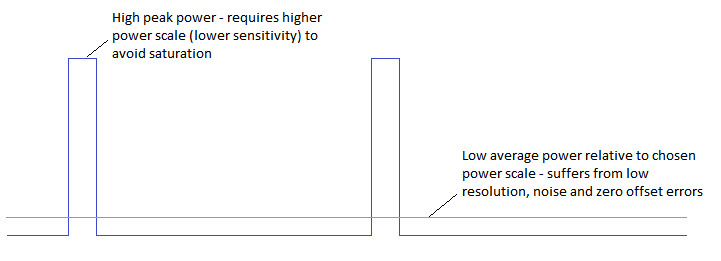
In general the most sensitive power scale should be chosen that does not show “over” on the display, indicating some kind of saturation. The firmware will notify the user when saturation is taking place, allowing the user to choose a less sensitive power scale when required. Note that sometimes the electronics may saturate (show “over”) at lower levels of average power than the power scale could theoretically accommodate. For example, if choosing the 300uW scale, it is possible that “over” will be shown when measuring only ~100uW average power - it depends on the exact combination of duty cycle of the pulsed source, the internal power scale chosen automatically by the firmware, the laser wavelength chosen in the software, and other factors. The important thing to note is that the firmware will tell the user when a less sensitive scale needs to be chosen.
In addition, if the average power exceeds the maximum allowed by the chosen scale, for example 350uW on the 300uW scale, the message “OVER” (upper case) will be shown instead of “over” (lower case). This is a convenient way for the user to understand what the problem is causing the saturation.
Auto-ranging is disabled when using this mode.
As described above, when measuring pulsed signals with low duty cycle, the chosen power scale needs to be less sensitive than would be optimal for a CW signal of similar average power. This potentially leads to higher noise than would be the case for an equivalent CW signal. In addition, due to the unstable nature of the signal being measured, higher noise is still inevitable. While the “Low Freq. Power Mode” will improve overall performance relative to the regular power mode, a certain increase in noise is still likely to be observed. In some cases it may be possible to reduce noise by averaging power measurements over a longer period.
Sometimes the hardware may provide sufficient low pass filtering to smooth out peaks of power caused by the pulsed signals, thereby improving performance and reducing noise. Low pass filtering can vary from ~160 Hz (1 ms response time) for the least sensitive analog ranges, ~2 Hz (86 ms response time) for moderate sensitivity ranges, and down to ~0.64 Hz (250 ms) for the most sensitive ranges. The internal range is chosen automatically by the firmware when selecting a power scale. When an analog range with heavy low pass filtering is selected, using the regular power mode may sometimes be a better choice than selecting the “Low Freq. Power Mode” where a less sensitive analog range may be selected automatically.
The following steps are recommended:
First try selecting regular “Power” mode. Choose the most sensitive scale possible that does not cause “over” Observe the power measurements to determine if the data is stable or noisy If the signal is very noisy, switch to Low Freq. Power Mode. If the data is stable, change up by one power scale (for example, from 3 uJ scale to 30 uJ scale) Check the average power measured is the same on successive power scales - if not, that might indicate saturation on the more sensitive power scale. In that case, switch to Low Freq. Power Mode.
For photodiode sensors with a “Filter IN” option, in some cases it may be better to use the additional filter and set the Power Meter to “Filter IN” option, thereby reducing the signal on the photodiode and forcing the firmware to choose a more sensitive internal analog range which has heavier low pass filtering. This may provide better performance for pulsed signals.
Many Ophir “meters” (with LCD displays) and “devices” (with direct connection to PC via USB or Ethernet) will be offering the Low Freq. Power Mode. These include the StarBright and Centauri meters; and the Juno and EA-1 devices. Ophir’s “StarLab” PC application will support all these meters and devices. Some OEM sensors will also be offering a similar solution. Introduction on the various platforms is planned for Q2 2019.

 Ultra-High Velocity