Beam Profiling of 1 KW Fiber Laser with Camera-Based Profiling System
Fiber Laser Source
- 1070 nm
- 600 μm fiber
- CW
- 1 kW max average power
- 5-axis movement
- Class 1 workstation
- 125 mm focusing lens
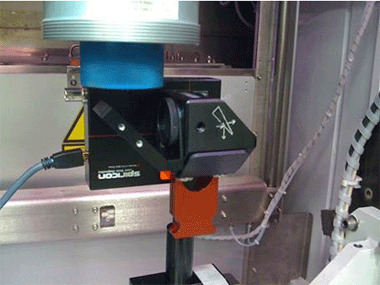
Spiricon Beam Profiler
- BeamGage Professional
- SP620U camera
- LBS-300-NIR with SPZ17015 beam splitter on input
- ND 1.0 + 0.7 used for 350 to 750 W
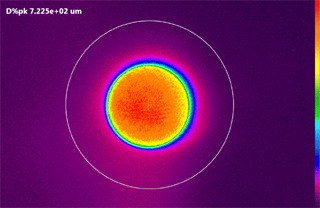
- 13.5% of peak beam diameter measured method applied
Results
Setup and location of the beam was relatively simple. The X and Y movements were used in conjunction with the 633nm target laser to center the beam on the camera chip. Once the beam was located and an approximate Z position was made using the target laser, the motorized Z stage was used to tweak in the image of the focused spot.
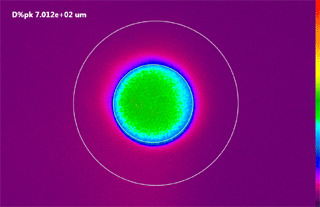
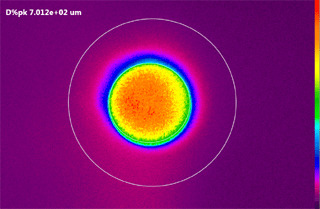
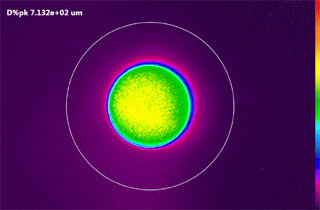
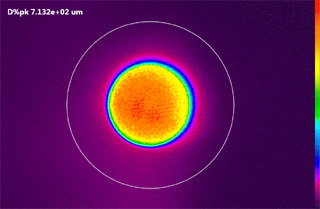
We took profiles at 350 W, 500 W and 750 W. We could have taken a profile at 1000 W, but the tooling plate we were using for the beam dump was taking a beating and they didn’t want to push it higher than that. The images resulted in an elevated background, but it was not due to a lack of UltraCal. We were using a piece of steel tooling for a beam dump and I suspect that the amount of scattered light from the tooling was enough to elevate the background. Manual draw shape was used for beam diameter measurements. Customer will purchase a beam dump.
The SPZ17015 Wedge and the LBS-300 assembly did get fairly warm during the demo, as expected. The damage threshold of this wedge was high enough to withstand the high average powers
Customer was expecting a Gaussian profile, but more of a flat top profile was what resulted.
Between the demonstration and the system sale, the customer added the requirement to be able to check focused spot +/- 12mm. This could only be achieved by adding a -100 mm lens and BeamGage will apply an optical scale to compensate for the resulting larger beam diameter.
Pictures of Beam Profiling Images