Sometimes, a solution designed for one measurement challenge turns out to be useful in a completely different application.
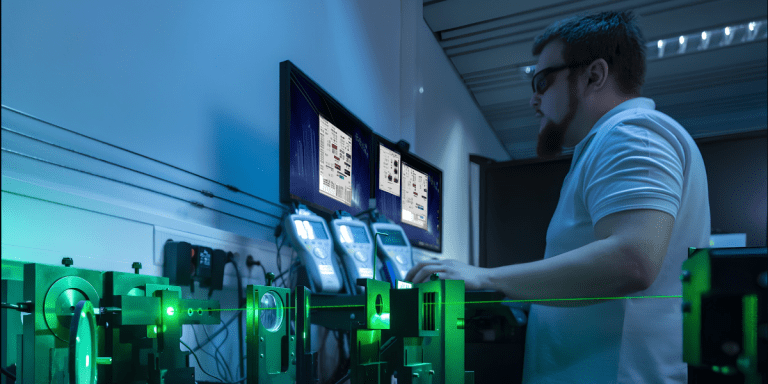
That was the case when a customer came to us with an issue in a low-power optical measurement setup. They were developing a proprietary system that included a small screen generating a video image. Their goal was to measure the total optical power emitted by the screen.
Based on the power level and wavelength, they were using a PD300 photodiode-based power sensor with a Vega meter. At first, this seemed like a straightforward low-power measurement.
But the readings didn’t make sense.
The Measurement Challenge
The customer noticed that different power ranges produced very different results. For example:
- On the 300 µW range, the reading was 160 µW
- On the 3 mW range, the reading was 428 µW
There was no clear “over range” warning, but the difference between readings made it obvious that something was wrong.
The Hidden Factor: A 60 Hz Raster-Scanned Beam
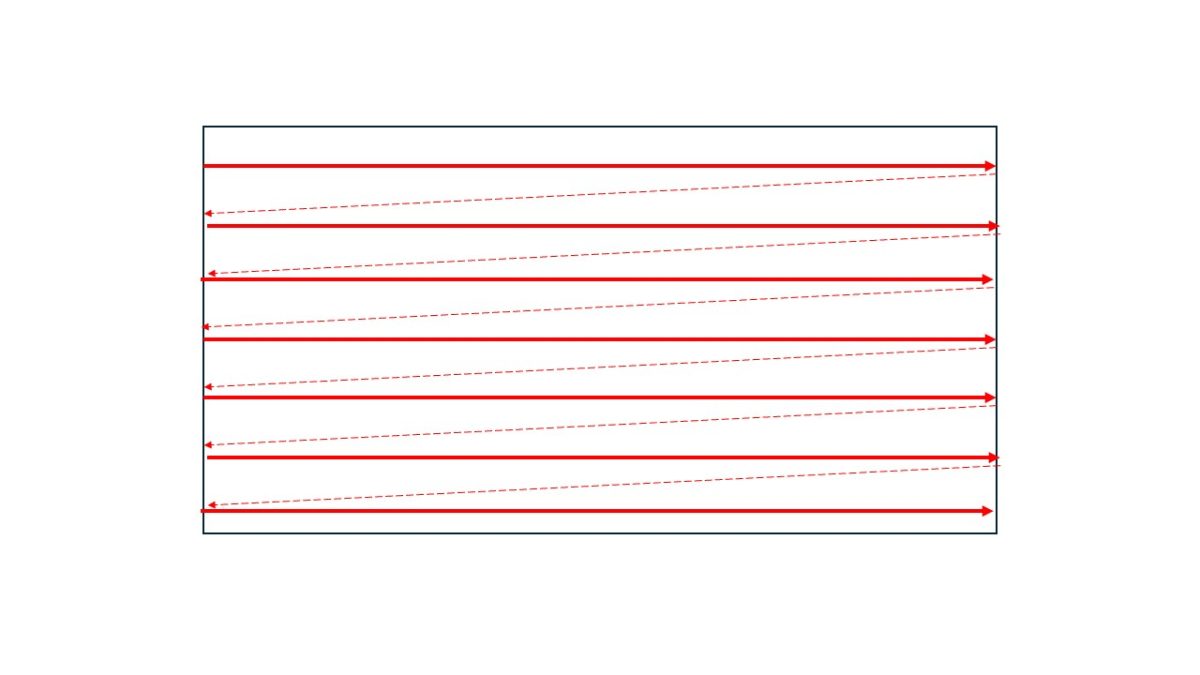
The screen image was being generated using a standard video format based on a raster scan.
In this type of system, a CW laser beam scans across a line to create one row of the image. The beam then dims while quickly returning to the start position, one step lower, to begin the next row. This process repeats until the full rectangular image is created.
Although the source was based on a CW laser, the raster-scanned video format meant that the light being measured was effectively pulsing at 60 Hz.
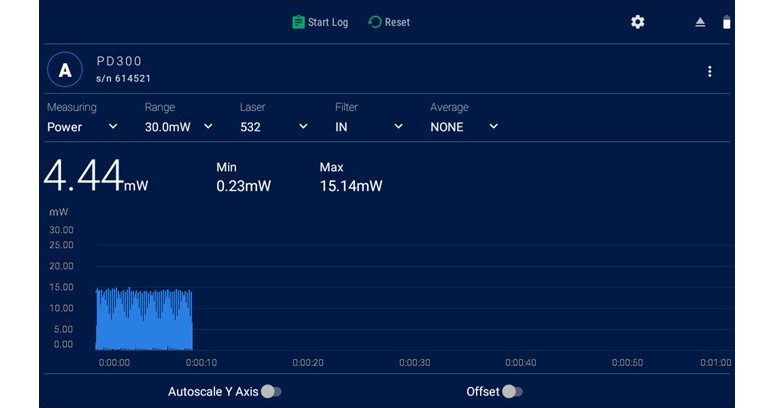
Why Standard Power Measurement Struggled
When using a standard sensor and meter to measure optical power, the meter samples the sensor signal at a defined rate. Ophir meters sample at 15 Hz.
This can create challenges when measuring a low-power beam that is pulsing at a similar frequency range. With a photodiode-based sensor, which is physically fast enough to follow the pulsing signal, several effects can influence the reading, including:
- A beat frequency between the beam’s pulse rate and the meter’s sampling rate
- Momentary saturation during the pulse
- Range-dependent measurement behavior
This is why the customer saw inconsistent readings across different power ranges.
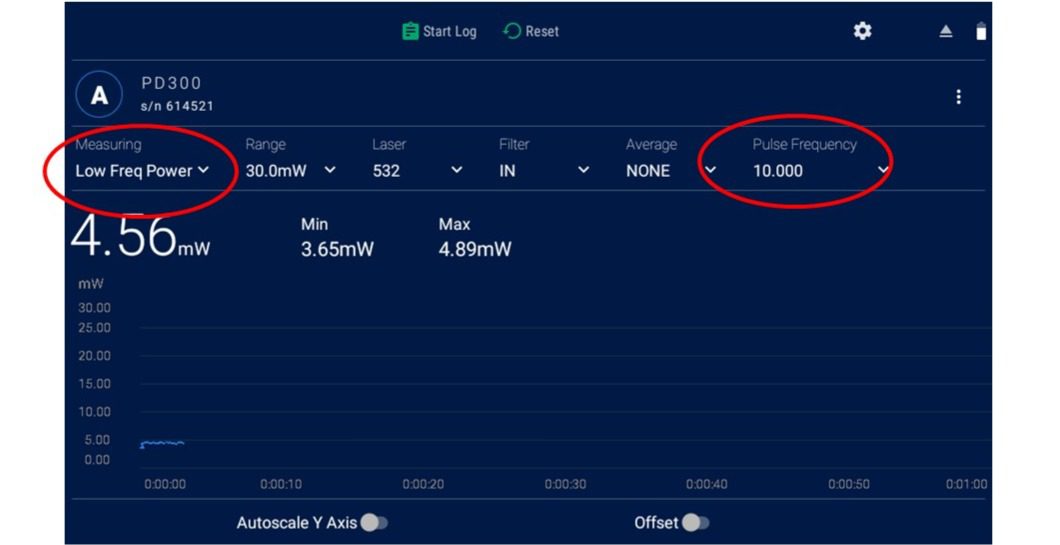
The Solution: Low Frequency Power Mode
To address this type of measurement challenge, Ophir developed Low Frequency Power mode, which is supported by several Ophir meters.
The problematic measurement was repeated using the same photodiode sensor, but this time using a “Centauri” meter operating in Low Frequency Power mode.
The result was stable and accurate measurement performance.
Problem solved.
Key Takeaway
When a low-power optical source appears to produce inconsistent readings, the issue may not be the sensor or the meter. The source itself may be pulsing at a frequency that interacts with the meter’s sampling rate.
For low-power, slowly pulsing beams—especially when using photodiode sensors—Low Frequency Power mode can provide the right measurement approach.
FAQ
Why do laser power readings change between measurement ranges?
One possible reason is that the source is pulsing and the sensor signal interacts with the meter’s sampling rate. This can create range-dependent behavior, especially with fast photodiode sensors. Other factors may also affect readings between ranges, but in this case, the pulsing behavior was the key issue.
What is Low Frequency Power mode used for?
Low Frequency Power mode is used to measure low-frequency pulsed or modulated optical signals more accurately, especially when standard power measurement produces unstable or inconsistent readings.
Can a CW laser behave like a pulsed source?
Yes. In systems such as raster-scanned displays, a CW laser can effectively behave like a pulsed or modulated source because the beam is scanned, dimmed, and refreshed at a defined frame rate.