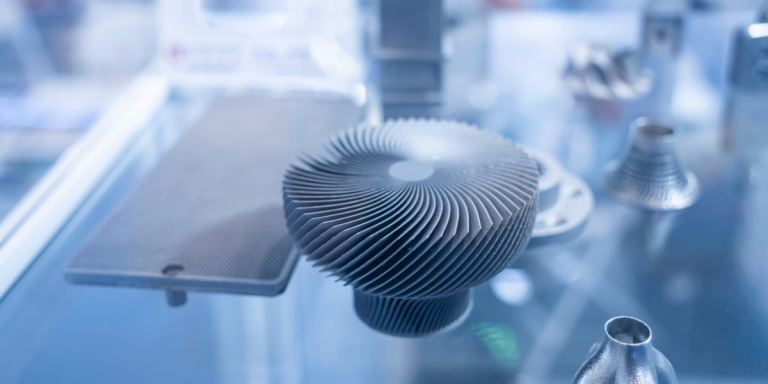
From automotive VINs to medical UDI/GS1 DataMatrix codes, laser marking underpins traceability and compliance across industries. Modern stations can correct X/Y/θ, maintain Z focus, and stream health data for analytics. But outcomes still hinge on physics: the beam propagation factor (M²) governs true focusability, peak fluence at the work plane, micro‑stroke edge crispness, and ultimately code readability at line speed. In ISO terms, M² is the “times‑diffraction‑limit” factor that inflates spot size and reduces fluence when the beam deviates from ideal Gaussian behavior.
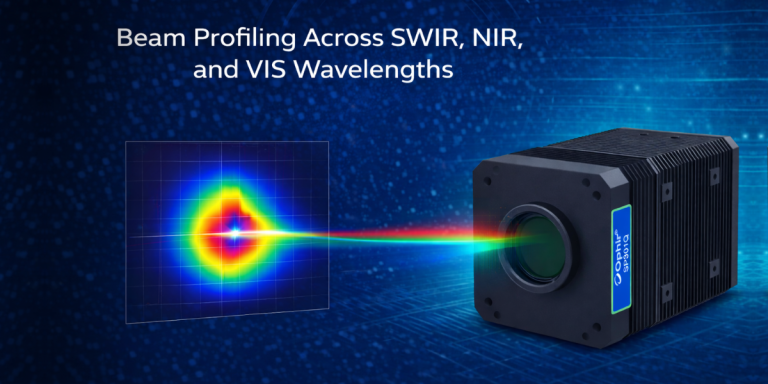
Instruments like Beamsquared make this measurement practical for production environments, ensuring compliance with ISO 11146 and quality control.
Although modern marking systems have evolved dramatically in automation and software, the underlying physics driving mark quality has remained constant. The following timeline places these developments in context and highlights why M² has become a practical KPI only in recent years.
The 30‑year timeline: 1990s → 2025
1990s: CO₂ and Nd:YAG era
Compact CO₂ lasers (10.6 μm) enabled on‑the‑move coding on organics, while Nd:YAG dominated metals. Typical platforms used 2‑axis galvo scanning over an f‑θ field, introducing edge‑spot distortion at large scan angles; cylindrical or inclined parts were handled via fixtures and rotation.
2000s: Active 3‑axis control and rise of 1 μm solid‑state/fiber sources
Adding an active Z scanner kept focus uniform across wide areas or complex shapes, reducing mechanical motion. In parallel, efficient 1 μm sources (solid‑state/fiber architectures) gained share for metals due to compact heads, lower maintenance, and higher engraving throughput.
2010s: Telecentric optics, green (532 nm), and UV “cold” marking
Telecentric scan optics kept chief rays near‑parallel to the optical axis, reducing geometric distortion across the field and stabilizing line widths even with part-height variation. Green (532 nm) improved absorption on certain materials, while UV (355 nm) enabled high‑contrast “cold” marking on plastics and glass via photo‑ablation at suitable fluence regimes – minimizing the heat‑affected zone compared to longer wavelengths.
These wavelength options expanded application coverage: 532 nm for some reflective metals and polymers, and 355 nm for medical plastics, microelectronics, and glass, where minimal thermal damage is critical.
2020s: Smart markers – autofocus, on‑head vision, analytics, predictive maintenance
Stations increasingly integrate full‑field autofocus, embedded vision/OCR for X/Y/θ correction, inline code grading, and predictive maintenance pipelines aligned with Industry 4.0, streaming device health and process data to edge/Cloud for anomaly detection and uptime.
Industry convergence on “smart” features
Across leading builders, you see similar stacks: turnkey class‑1 stations, embedded vision/OCR, autofocus/3D marking over large height variations, and data connectivity for automated cells and analytics.
Despite this convergence, marking quality across OEMs still varies widely, often traceable not to software or mechanics but to beam mode quality and how consistently it is measured and monitored.
Why Beam Quality (M²) is the hidden KPI?
Autofocus keeps Z right. Vision/OCR keeps X/Y/θ right. Power/lens monitors flag contamination or drift. But the spatial mode of the beam, quantified by M², ultimately sets achievable spot size, energy density, and stroke‑edge crispness.
Definition: In ISO 11146, M² is the ratio of the beam’s beam parameter product (BPP) to the diffraction‑limited value λ/π. Thus BPP = M² × λ/π, and the divergence relates as θ = M²λ/(πw₀).
A diffraction‑limited Gaussian has M² = 1. Effect on fluence: For equal input diameters and optics, the focus area scales roughly as M⁴; practically, doubling M² can quarter peak fluence, visible as lighter marks and fuzzier edges at line speed.
ISO 11146 & measurement: making M² a production KPI
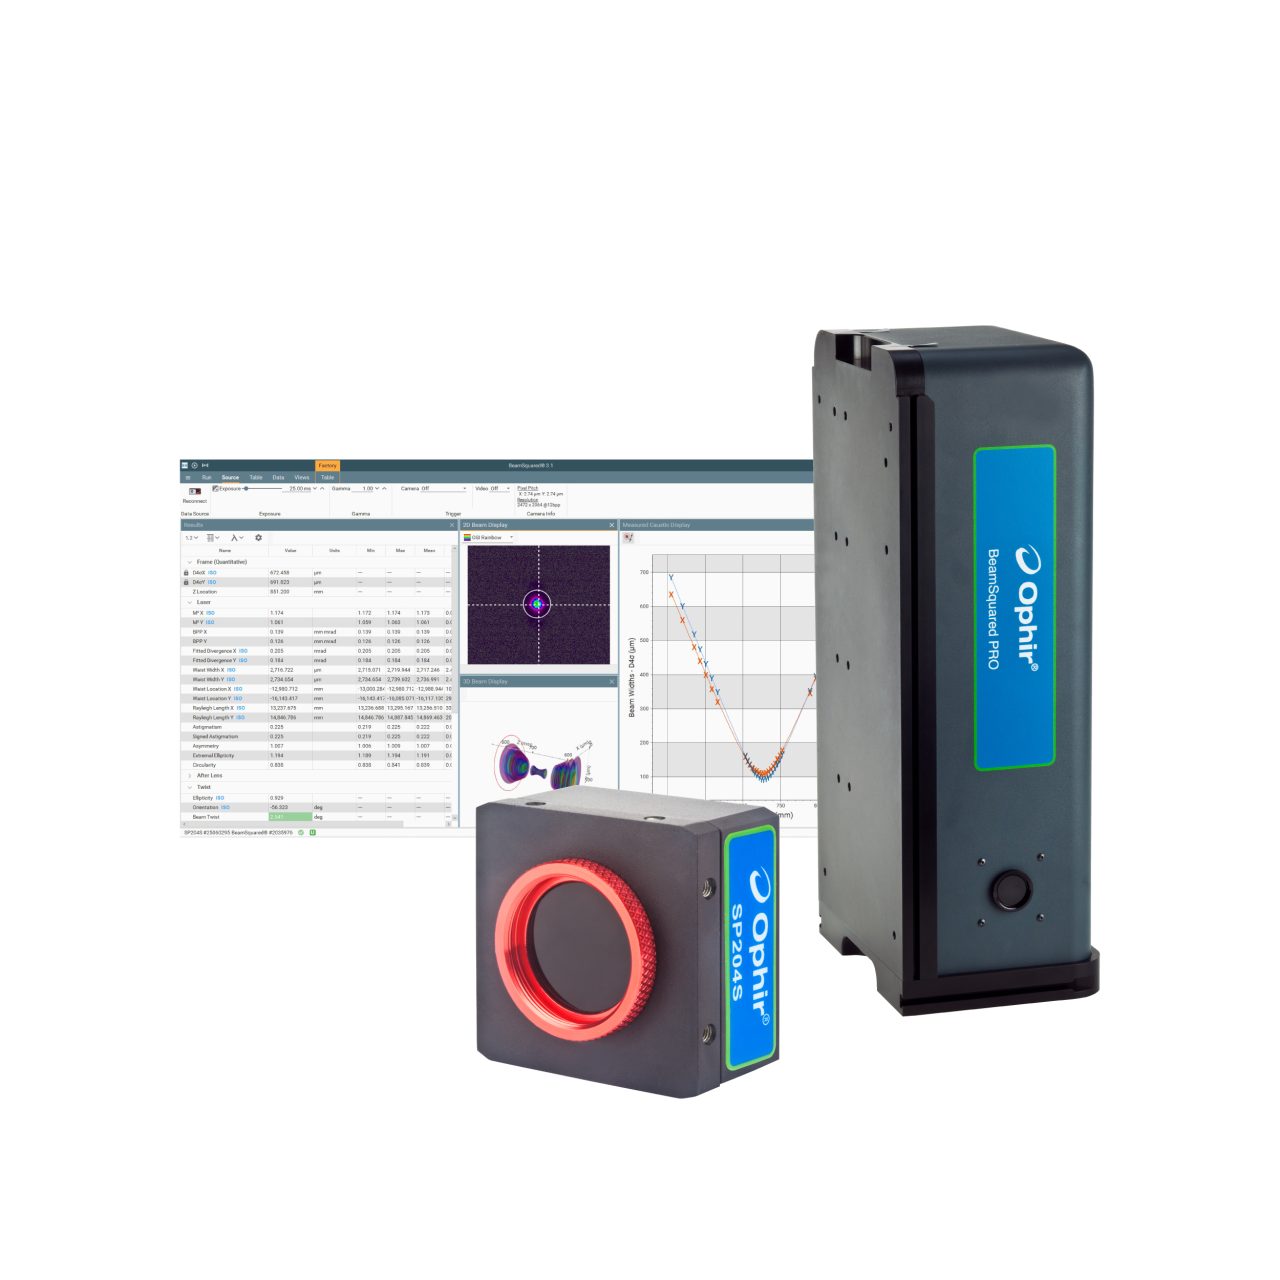
ISO 11146‑1/‑2 specify beam widths (D4σ), divergence, and M² using multi‑plane propagation fits. The practical workflow: Start from a collimated beam and use an aberration‑free focusing lens of known focal length. Measure beam radius at multiple axial positions: several near the waist and several at least one Rayleigh length away.
Fit the ISO propagation model to compute w₀, z₀, M² with second‑moment (D4σ) diameters to avoid definition bias. Ophir Beamsquared automate ISO‑compliant M²/BPP measurement across near‑ and far‑field planes, reducing operator variability and making M² practical as a line KPI (waist, divergence, depth‑of‑focus) for ongoing capability audits.
Conclusion
Control stacks stabilize the where (X/Y/θ/Z). M² stabilizes the how – how small, how crisp, how readable.
If you want consistent micromarks and reliable DataMatrix grades at takt time in 2025, treat beam quality (M²) as a first‑class KPI: specify it, measure it with Beamsquared.