Need more help? Ask one of our experts! and we'll contact you as soon as possible
New Online Calibration Portal
Calibration – High Precision & Lower Cost
How Can Calibration Help Me?
Calibration Wavelength
Calibration of Ophir L50(300)A-IPL sensor for use with gel coupled IPL sources
Calibration Accuracy of Ophir’s High Power Sensors
Calibration Capability at Ophir
What’s New: Calibration Portal
How Can Calibration Help Me?
Spectral Wavelength Calibration
Calibration of Ophir Terahertz Sensors
When sending in a Power Meter for repair and/or re-calibration
Technical Note - Magnification Calibration Procedure
I’m Not Required to Calibrate My Equipment Based on ISO or FDA Requirements. So Why Should I?
How Continuous Improvement in Customer Service Affects You
Laser Power Sensors introduction
What Does an ISO/IEC 17025 Accredited Lab Offer That is Not Provided By ISO 9001 or Other Certification?
New 3-Day Expedite and 24-Hour Super Expedite Options
Bridging the THz Gap in Radiometry
Using the FL250A-LP1-DIF-33 at "None of the Above" wavelengths
Raising the Standard of Service
Expanded ISO Accreditations
Can a Speeding Driver Avoid Paying a Fine by Claiming the Police LIDAR Meter was Incorrect?
Water Cooled Sensor
Three tips to protect your BeamSquared device
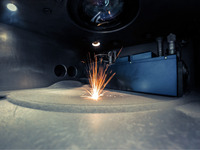
Sensor Fusion Enables Comprehensive Analysis of Laser Processing in Additive Manufacturing
Measuring Broadband UVA And Violet Led Light Sources For Industrial And Medical Applications
How to avoid damage to your thermal sensors
Making Waves in Recalibration and Repair
A discussion of Laser Beam Profiling and the subject of Accuracy
Common Reasons for Photodiode Sensor Damage or Out of Tolerance Conditions
Longer Length Sensor Cables
Effect of Ambient Conditions on Laser Measurements
Integrating Sphere Fundamentals and Applications
The Telescope Array Project
Measuring Non-Laser Light Sources with Commercial Laser Beam Profiling Systems
White Paper – ISO compliance of non-contact, real-time beam analysis
BeamSquared® - Measurement of Long Rayleigh Range Lasers with Small Focal Spot
Ophir-Spiricon Laser Measurement in Medical Laser Service
Laser Power / Energy Measurement Today
The Use of Ophir Instrumentation in Law Enforcement
White Paper – Cheaper is always more expensive in the long run
Laser Beam Diagnostics in GHz Applications
Wireless Connectivity for Laser Power/Energy Measurement
VCSEL Measurement Solutions
Reimaging UV Laser Beam Profiling
Laser forensics: The invisible, revealed and measured
Case Study Asclepion – Consistent measuring technology ensures the quality of medical lasers
Simple alignment procedure of the MS-1780 Real-Time M² Analyzer
How Ophir can modify to meet your OEM requirements
White Paper – Beam Width Measurement Accuracy
Using the built in photodiode trigger on the SP620U and SP503U cameras.
Lasers and Solar Cell Manufacturing, Scribing of Photovoltaic Materials
How to easily speed up end-of-line quality testing for lasers
Ensuring High Cutting Speeds Through Accurate Beam Power Measurements in Multi-Kilowatt CO² Laser Machines
Please send an e-mail request to our Calibration department that includes the S/N of the device you are missing the Certificate of Calibration for and we would be happy to e-mail you a copy of the latest Certificate of Calibration for the device. Calibration@us.ophiropt.com
Ophir offers a "special calibration" service so the customer can be provided with higher calibration accuracy than the standard catalog accuracy. To learn more
You can get an RMA for recalibrating your NanoScan by sending an e-mail to Calibration@US.Ophiropt.com and requesting an RMA.
The standard turn-around time from receipt to issuing quotation for power meter calibration is less than 5 days. We do offer additional expedite service for 3 days and super expedite for within 24 hours.
The calibration process insures that a sensor is working within in-tolerance performance, similar to “as new” condition. Typically when there is a damaged area on a power sensor disk, that particular area will exceed the disk uniformity specification, which is ±2% across the active surface area of the disk, and therefore (with a damaged area on a sensor) it will be rejected for calibration because it is outside of the acceptance criteria to pass the calibration procedure requirements.
The Power Accuracy of +/-3% refers to the absolute uncertainty of the measured value. For example, for a 2 Watt reading, the actual "true" value would be between 1.94 W to 2.06 W (with reference to NIST, to which all our calibration is traceable). This assumes the reading is from about 5% of full scale up to full scale. It should be noted that our accuracy specification is in general based on 2 sigma standard deviation.
Repeatability of the measurement (assuming the laser itself is perfectly stable) is limited in the best case by the power noise level of the sensor, and is typically better than +/- 1% depending on the thermal stability of the environment. Stability at higher powers from the middle to the top of the range of the sensor head is usually better than the low end. This is due to small temperature variations having less of an effect as they are proportionally a lower percentage of the total power. For more information, refer to our Web tutorial at: https://www.ophiropt.com/laser-measurement-instruments/laser-power-energy-meters/tutorial/calibration-procedure
After numerous requests for re-calibration of M2 systems, in 2008 Ophir-Spiricon started a recalibration program for its M2 systems. This program allows the equipment to be sent back to the factory to be inspected, lubricated and re-calibrated. This enables customers to comply with their ISO regulations. Please click the below link to be directed to a section of our web site where you can request an RMA to return your equipment for re-calibration.
https://www.ophiropt.com/laser-measurement-instruments/customer-support/...
The answer to this question is two-fold. First of all the recalibration process accomplishes the recalibration of the sensor and returns it to "as-new" working condition. If there is surface damage on the sensor disc that creates areas of non-uniformity exceeding the uniformity across-the-surface specification, then the disc needs to be replaced, even though the accuracy performance of the sensor is not out-of-tolerance. Secondly, many applications require that sensors be found in-tolerance during the calibration process, or else deviation explanations are required and/or costly recalls may need to be implemented. The calibration process is intended to help maintain the sensors within tolerance if at all possible.
All absorbers used in power/energy measurement are not entirely flat spectrally, that is, they vary in absorption with wavelength. For this reason, Ophir measuring sensors are usually calibrated at more than one wavelength. If the absorption changes only slightly with wavelength, then we define wavelength regions such as <800nm, >800nm and give a calibration within these regions. In that case, the error in measurement between the wavelength the device was calibrated for and the measurement wavelength is assumed to be within the primary wavelength calibration error.
No, the firmware upgrade is independent of the calibration and does not affect it.
The Pyrocam IIIHR and IV have a Certificate of Calibration for the detector recess distance and a Certificate of Camera Performance. See the attached examples.
We do certify the Pyrocam IIIHR and IV for operational performance against our internal standards that new equipment must meet and recommend annual re-certification for continued optimal performance. Because this is a Certificate of Camera Performance, it is up to the customer to decide if they want to send the camera back on an annual basis for re-certification. See our Knowledge Center article #9039 for more information. https://www.ophiropt.com/laser--measurement/knowledge-center/article/9039
The ModeCheck background calibration cycle may get stuck due to some environmental conditions which cause the wand position to become difficult to determine. You may be able to restore operation by cleaning the back side of the wand where the wand passes the optical sensor.
Since there is no calibration standard to calibrate cameras to, they cannot be calibrated. We do recommend certification according to the information at; https://www.ophiropt.com/laser-measurement-instruments/customer-support/...
An explanation of how we can accurately calibrate at a fraction of the maximum power is given in our catalog introduction and on our website. In addition, in order to be sure of the calibration at higher powers, we have to know if the linearity of our sensors is within specification. For this purpose we have a 1500W sensor calibrated at various powers at a standards lab. Using a beam splitter and a 15,000 Watt laser we periodically check the linearity or our highest power sensors against this secondary standard.
Yes, since the BeamPeek includes Ophir regular Power Meter.
No. the self-absorption measurement is a relative measurement, so keep the wavelength setting at wavelength of the LED you are measuring.
The absorber is calibrated at 532nm, covering the visible and UV region. At 355nm it reads less than 0.5% higher that at 532nm and at 266nm, it reads 1-2% higher.
Over time the equipment can become damaged, dirty, or drift and it is recommended to have the equipment recalibrated every year to make sure the equipment is measuring accurately within its allowable tolerances.
All Ophir power meters, including photodiode power meters, have an air gap between the fiber tip and the sensor. Therefore they measure the power emitted by the fiber into the air and do not take into account any reflection losses there are in the fiber. Therefore, if in actual use, the fiber will be coupled with no loss to another element, then the losses should be added to the reading. These losses are usually about 4%. Thus if the reading on the Ophir meter is say 100mW, then in lossless use, the real power will be 104mW.
The Ophir integrating sphere sensors, models 3A-IS and 3A-IS-IRG have a white diffuse reflecting coating on the inside of the integrating sphere. The sensitivity of the sensor is quite sensitive to the reflectivity of the coating. If the coating absorption goes up 1%, it can cause a 5% change in reading. Therefore, care must be taken not to soil or damage the white coating of the sensors. Also it may be a good idea to send the sensors for recalibration yearly.
Customers often measure the same laser with 2 different Ophir sensors, both of which are specified to be within calibration. Let’s say that both of the sensors are specified to have a calibration uncertainty of ±3%. Do I expect the difference in reading between them to be less than 3%? On the first thought, this is what one might expect. However this is not necessarily so.
First of all, when we specify a calibration accuracy of ±3%, we are talking about a 2 sigma uncertainty, i.e. the readings of various sensors will be within a bell curve with 95% of all sensors reading within 3% of absolute correct calibration and 5% reading outside this accuracy. Thus there is a small chance that the meter will not be reading within 3% of absolute accuracy.
A more important reason is that the two sensors’ calibration error may be in two different directions and thus show a larger discrepancy between them than 3%. Say one sensor has been calibrated and reads 2.5% above absolute calibration and the other 2.5% lower than absolute calibration. Both of the sensors are within the specified ±3% absolute calibration but they will still read 5% differently from each other.
If we do statistical analysis, the analysis will show that there is in fact a probability of >16% that two correctly calibrated sensors will differ in reading from each other by more than 3% and a probability of over 6% that the sensors will differ in reading between each other by more than 4%.
We now have a portal on our web site for calibrations. You can request a username and password by e-mailing us at calibration@us.ophiropt.com. After that, you can log in and check the status of your RMA at any time.
Below is a link to this portal. It is currently available only for US customers.
https://calibration.us.ophiropt.com
The starting point - the calibration measurements themselves (using the moderate-power lasers) - are all based on NIST-calibrated “master” sensors.
Basing high-power calibration accuracy on lower power calibration measurements is valid, subject to the condition that the sensors are linear all across the full power range.
A series of detailed tests have confirmed that indeed these sensors are highly linear, all the way up to the highest powers for which they are rated.
Since the thermal sensors have been shown to be linear over their entire range of powers, it follows that if the calibration is correct at low powers, it will remain correct at high powers as well.
The Ophir specification on accuracy is in general 2 sigma standard deviation. This means, for instance, that if we list the accuracy as +/-3%, this means that 95% of the sensors will be within this accuracy and 99% will be within +/-4%. For further information on accuracy see https://www.ophiropt.com/laser-measurement-instruments/laser-power-energy-meters/tutorial/calibration-procedure and https://www.ophiropt.com/laser--measurement/knowledge-center?search=calibration&=SEARCH
The accuracy specification is ±3% of any given reading. This is the accuracy of the calibration under the conditions of calibration. To this must be added other uncertainties if they exist. For more details see: https://www.ophiropt.com/laser-measurement-instruments/laser-power-energy-meters/tutorial/calibration-procedure
When using a camera with a lens, the operator must perform a spatial calibration to obtain accurate dimensional results. To do this, you must set up the camera lens system to view an object of a known dimension. The object to be viewed must contrast against its background to yield well defined edges. Use the following procedure.
- In the Camera Dialog Box, set the "Pixel Scale" V value to 1.
- In the Beam Display Toolbar Dialog Box check "Cursors" and "Crosshair"
- In the Camera Dialog Box set the "Resolution" to 1X.
- On the Beam Display Toolbar set "Crosshair" to Manual and "Cursor" to Manual.
- Set the LBA into "CW Mode" and start it "Running."
- Place an object containing at least one known dimension into the imaging plane of the camera lens system, and focus the optics. (A good object might be a circular disk with a diameter of 1cm.) The object should be large enough to fill over 50% of the display height. You can hardware zoom to enlarge the object if necessary. Orient the object so that the calibration dimension aligns vertically on the Y axis cursor. You can use the Pan and Cursor controls to achieve a good alignment.
- With the mouse and left button move the cursor to one edge of the object
- With the mouse and left button move the crosshair to the object's opposite edge. The Delta = value on the screen will contain the pixel count between the known calibration dimensions. Divide this number into the calibration dimension to yield the correct "Pixel Scale" value.
- For example, if a 1cm distance produced a delta count of 176, then the "Pixel Scale" value would become .00568cm, or 56.8µm.
Select an attached power meter or use the manual calibration tool if power calibration is required. If calibration is required counts will turn to an actual power reading for the total frame power or energy:
You said you need an average so I will assume "Total" is the item you are averaging. It could be any results just enable the one(s) you need:
You need to average 100 shots at 30Hz each hour so you will need to use the Burst Capture feature. The controls below (as currently set) will capture 100 frames every hour in results priority mode (what you need for this requirement).
Provide a log file name here:
Set frame averaging to 100 because you want to average the frames collected. This will produce results that are an average of 100 samples.
Set logging to continuous as you will stop it manually after 30 days.
You could also do the math (Days x Logs Per Day = Total logs or 30x24=720) and figure out how many samples a 30 day log would produce at this rate and place this number in the box below in place of the 1 you see now. Then click on the "Folder/Play-Button" icon to the right of the spin buttons to enable "Stop after X Logs"
When you are ready to start logging, make sure the data source is running and click on the top middle icon you see here, which is the results logging button (has the 1.2 in the icon):
When you are running and click the "Log Results" button the logging to disk will begin.
2D and 3D images (Pro release to introduce image logging) can also be logged by enabling the required image file types here:
Use Excel to import the data from the log file with comma delimiting and you will see the following type of log: This log of total frame counts was made using burst capture of 100 frames every 5 seconds.
Tip: When you setup a log in this way you will only see the frames that are logged appear in the BeamGage beam displays. If you are logging one sample an hour you will not see a lot of activity in the beam display windows. Not to worry, you have the power of Multi-Clienting at your finger tips so you can minimize this instance of BeamGage and let it go on logging in the background (maximize it again when you want to see the last frames logged). Now, launch a new instance of BeamGage and connect to the same camera. Because the camera is set at 30Hz you will see a 30Hz video feed in the second instance of BeamGage. This will allow you to monitor in real-time while you are logging in slow-time.
Behold, the power of subscription rate when combined with logging and multi-clienting.
Each Ophir sensor data sheet states its accuracy, typically something like ±3%. This refers to the absolute uncertainty of the measured value. For example, for a 2 Watt reading, the actual "true" value would be between 1.94 W to 2.06 W (with reference to NIST, to which all our calibration is traceable). To this must be added other uncertainties, if they exist. This assumes the reading is from about 5% of full scale up to full scale. It should be noted that our accuracy specification is, in general, based on a 2 sigma standard deviation.
This White Paper explains in detail exactly how we arrived at the accuracy numbers we specify, and what exactly they mean: Ophir Power/Energy Meter Calibration Procedure and Traceability/Error Analysis.
The short answer is…sort of.
There are 2 main issues that link measurement accuracy to beam diameter:
- Uniformity of the sensor’s response across the aperture
- Fraction of the sensor’s aperture that the beam fills
Because there is a tolerance on surface uniformity across any sensor’s aperture (there always is), beams of different sizes will of course be affected differently since they take up different chunks of the total surface. The actual uniformity spec varies from sensor to sensor. In general, the uniformity is better than +/-2% over the central 50% of the area (70% of the diameter), and for many sensors considerably better than this. For more information see our tutorial at https://www.ophiropt.com/laser-measurement-instruments/laser-power-energy-meters/tutorial/calibration-procedure.
Regarding the recommended portion of a sensor’s aperture that a beam should ideally fill: There is a balance here between several factors. All other things being equal, an ideal fraction of sensor aperture would be somewhere between 1/3 and 2/3. Please see this short video for a clear explanation.
On the Certificate of Calibration there is also listed the same “D” to indicate that the diffuser is installed for this wavelength calibration. If the diffuser cannot be removed, the wavelength remains the standard wavelength. An example would be: 532 for a 532 nm source.
Ophir "Thermal" detectors have flat regions of response over their entire usable range. Ophir does a calibration for this flat region and when the detector is no longer flat it gets a new calibration for this new flat region. This is why there are regions instead of discrete wavelengths.
With normal usage we recommend calibrating every 12 months. To accommodate shelf time and shipping time new manufactured product comes with a calibration sticker that shows a recalibration period of 18 months from manufacturing. However this does not negate the recommended 12 month recalibration interval should you receive the product with more than 12 months remaining on the new manufactured calibration sticker.
It varies from sensor to sensor. In general, the uniformity is better than +/-2% over the central 50% of the area and for many sensors considerably better than this. For more information see our tutorial at https://www.ophiropt.com/laser-measurement-instruments/laser-power-energy-meters/tutorial/calibration-procedure
The PD300 series of photodiode-based sensors are calibrated with a full spectral curve using a scanning monochromator (plus a few laser "anchor points").
The wavelength ("Laser") setting tells the meter what wavelength is being used and hence what calibration factor to apply when a measurement is underway. It does not, however, physically limit the possibility of other wavelengths from entering. All light (within the sensor's specified range of course) entering the detector will be measured; the meter will apply the calibration factor meant for the selected wavelength, "thinking" that only that wavelength is present.
In other words, these sensors assume a monochromatic light source. Their relative spectral response is not flat and they are therefore not suited for broadband beams.
So, if you want to check one wavelength from a broadband source, you will need to use a wavelength filter that only passes that wavelength. Then you should set your meter to the appropriate wavelength to account for the detector's relative sensitivity.
If you can’t just arrange for a feedthrough of the cable through the chamber wall, then you’ll need to have panel-mounted connectors on the inside and outside of that wall; one cable segment connects from the sensor to the connector on the inside of the wall, and another cable segment continues from there to the meter. The trick is where/how to split the cable (you can see a short video about this question here. The starting point is that the D15 connector with the sensor’s EEPROM inside must be connected to the meter, and any split will be elsewhere along the cable. From there, for power sensors the simplest solution is to cut the sensor cable between the D15 smart plug and the sensor itself. There are only 2 internal wires and a screen/shield to connect, and the panel-mounted connectors will be simpler. (If you need to do this on multiple sensors, you’ll need to be careful to keep each sensor paired with its own D15 plug, as the EEPROM in the D15 plug is where the individual sensor’s calibration data is stored.)
More generally, such as for other sensor types, the usual way to approach this would be to use a “split cable” solution, where there would be a panel-mounted D15-to-D15 feedthrough connector on the vacuum chamber panel (the 2 D15 connectors would be “dumb”, i.e. without the EEPROM inside that holds the calibration data – their purpose would be just to feed-through), and from the outer connector there would be a second segment of cable terminating in a “Smart” D15 connector that connects to the meter. Consult with Ophir if this is of interest for you.
The old pyro sensors and the newer PE-C sensors are almost identical; the differences between them are as follows:
- More compact
- User Threshold – minimum energy threshold (below which the sensor will not trigger) can be selected according to users' needs
- Measures longer pulses (up to 20ms depending on model)
- Has up to 5 pulse width settings as opposed to only 2 pulse width settings
Disadvantages:
Smaller size and therefore:
- May need a heat sink (P/N 7Z08267) in order to stand up to higher average powers
- May need a mechanical size adapter (P/N 7Z08273) if it must fit into an existing mechanical jig designed for the older models
Meters and Software Support:
StarLite, Juno, Vega, & Nova II fully support the Pyro-C series. Laserstar, Pulsar, USBI, Quasar, and Nova / Orion with adapter* partially support the Pyro-C series:
- Only 2 of the 5 pulse width settings are available
- Lowest measureable energy cannot be selected (no User Threshold).
StarLab software supports both Pyro-C and older pyro series.
*Note: The PE-C series will only operate with Nova / Orion meters with an additional adapter Ophir P/N 7Z08272 (see details in Ophir website).
Wavelength Setting Names:
If you have your own software for communicating with the sensor, it may be important to note that for some models, the names of the wavelength settings are a bit different between the old pyro and the new PE-C, even though they mean exactly the same thing.
For example, with diffuser OUT, the settings in the PE50BB-DIF-V2 are called “<.8u” (i.e. visible, represented by a calibration point at 532nm that covers the full visible range), and “106” (i.e. 1064nm), while in the PE50BB-DIF-C these same settings are called “532” (i.e. 532nm, the calibration point for the visible) and “1064”.
Why wasn’t the firmware upgraded to the latest version when the meter was sent in for recalibration?
Our recalibration process is to not automatically upgrade the firmware in meters when they are sent in for recalibration, unless specifically requested to upgrade it. The reason for this is that we support many companies, such as medical companies, that have equipment validation processes that don’t allow changing the firmware version from the currently validated version. If you do want the latest firmware version installed, we will do that at no additional charge (for meters which are upgraded electronically) if it is specifically requested on the RMA request checklist form. For older meters (such as the Nova) that are upgraded through changing the EEPROM, a nominal fee is added, if firmware upgrade is requested. Note; upgrading the firmware does not affect the calibration.
This is one of our most-often-asked questions (we don’t call these FAQ's for nothing…). In general terms: There are a few factors that contribute to the final overall uncertainty in your measurement. For the sensor, these include, among others (and these are all mentioned in the sensor's datasheet):
- The "basic" specified measurement accuracy (a typical value might be +/- 3%)
- Additional uncertainty for wavelengths in the specified range that are not actual calibration points (this and those that follow are specified in the datasheet as "up to…x%" or similar)
- Linearity
- Additional error with frequency (for energy sensors)
- Uniformity across the aperture surface
Then it starts getting complicated… Some of these numbers would get combined statistically, as root-of-sum-of-squares. Basically, that happens when the errors are random (so one factor might in one case introduce some error in the high direction, but another factor might at the same time be introducing an error in the low direction). However, if you are for example working right near the top of a given energy range, or right near the maximum frequency specified for the sensor, then the additional error being introduced is not random at all; in such cases the numbers would have to be added arithmetically. For example, to give this some meaning:
Say you are working at <70% of the maximum energy of the range and <70% of the maximum pulse rate. In that case, the linearity and frequency-dependent errors can be assumed to be random. If the beam is, say, around 1/4 of the aperture and is centered, the uniformity error can be ignored (that's how we set it up when we calibrate the sensor, so by working in similar conditions you've eliminated some variables). In that case you may use statistical combination of errors to compute the expected total error. For instance if the stated "basic" measurement accuracy is ±3%, the stated linearity is ±1%, and the stated pulse rate dependence is ±1%, then the 2 sigma total error can be taken to be √ [(0.03)² + (0.01)² + (0.01)²] = 3.3% - only slightly higher than the "basic" 3%. If, on the other hand, the pulse rate or power approaches the maximum permitted, then you must take the maximum value as the expected total error, i.e. 0.03 + 0.01 + 0.01 = 5% in the above example. Just to add: Since the meter error is so low (typical electrical accuracy is specified as +/-0.25% new and +/-0.5% after a year), it can be ignored in most cases. You can find more in-depth information in this article and in this On-Demand Webinar.
No, the light scattered from the walls of the adapter that gets back to the sensor absorber is negligible and does not affect calibration.
The spectral range stated at the beginning of the spec indicates the range of wavelengths for which the sensor can be usefully used even if the exact calibration is not specified for that range. This means that over the calibrated wavelength range, the accuracy is specified and guaranteed. Over a wider useful wavelength range, the sensor is usable but no accuracy is guaranteed. In general over this wider range, the accuracy will be within up to ±15%.
Ophir's temporal sensors do not require calibration.
StarLab 3.50 does include new features which may require a firmware upgrade of the meter or PC interface, I.E. Juno, in order to operate with it. The required firmware is included with StarLab 3.50, but you do need to click on the More… link in the Select Device(s) menu in order to launch the Diagnostics menu and then proceed with the Upgrade firmware procedure. After performing the firmware upgrade, the meter or PC interface will connect with StarLab and operate normally. Note; Upgrading the firmware will not affect calibration.
The analog output of the meter - using the mating connector provided – gives a voltage signal proportional to the actual reading (it is in fact just a D/A translation of what is being displayed), so it represents a fully calibrated reading. The full scale value is a function of the meter being used and the power range it is on. With the StarBright, Vega and Nova II, for example, the user can select full scale analog output voltage ranges of 1v, 2v, 5v or 10v, and the 100% level of the chosen power scale is scaled to the full scale voltage. For example: if you choose 5V full scale analog voltage range, and your sensor is set to a 50W full scale power range, then you will have 5V = 50W or 0.1 V/W. It will vary according to the chosen power range and chosen full scale voltage range. The electrical accuracy is stated in the specification (see the User manual) as ±0.2% (of reading) ±0.3% of full scale volts (in addition to the calibration accuracy of the sensor’s reading itself).
Because of the design of the lenses for the new BeamSquared, you will be able to use lenses on multiple systems. We have included an RFID chip on each lens which holds the information for that lens. We have also programmed the BeamSquared optical trains to have their calibration information stored in the device. With this improvement the configuration files for pairing optical trains and lenses are no longer required making lenses interchangable.
Yes, click on the Computations tab and enter the reading from your Ophir power meter equipment into the Calibration Value editbox on the Power panel and click on the Calibrate button (checkmark) to correlate the Ophir power meter reading with your beam profile.
An unused port should be closed, to prevent unwanted light from entering the sphere. Closing it with a diffuse white port plug, however, adds the surface area of that plug to the (diffuse white) effective area of the sphere that is doing the “integrating”. For a calibrated integrating sphere sensor, this change in the behavior of the sphere changes its calibration, and results in incorrect readings. In such applications, a black “Port Cover” should be used.
It is NOT recommended to interchange the lenses between units. The M2-200s lenses are unique and serialized for the particular M2-200s unit they are provided with. Each lens includes calibration information for the Effective Focal Length and Back Focal Length that are entered into the specific serialized configuration files for each M2-200s. If lenses are interchanged between units, accuracy can be degraded. If lenses are lost or broken, we can replace them. If specific configuration files are lost, we do keep backup copies of them and can email them to you.
With Ophir's Smart Head technology sensors can be interchanged between different meters easily. The calibration and setting information is stored in the sensors Smart Head connector so it moves with the sensor to the new meter. It is recommended that you power off your Nova meter before removing the sensor, but the new Nova II and Vega meters detect that a sensor has been removed or attached and will power cycle themselves when doing this.
Ophir meters and sensors are calibrated independently. Each meter has the same sensitivity as the other within about 2 tenths of a percent. Each sensor is calibrated independently of a particular meter with its calibration information contained in the DB15 plug. When the sensor is connected to the meter, the meter reads and interprets this information. Since the accuracy of our sensors is typically +/-3%, the extra 0.2% error that could come from plugging into a different meter is negligible and therefore it does not matter which calibrated meter we use with a particular calibrated sensor.
The Quasar is no different than the other instruments that have electronic components: it requires annual recalibration. But it’s up to the customer whether to do this or not. We know that the calibration of the instruments degrades somewhat over time, as shown in the datasheet. This may or may not affect your particular application. To maintain compliance with ISO and other standards, we highly encourage annual recalibration.
The agent can order a replacement filter with software to load into sensor to update sensor calibration curve.
Generally, our sensors are calibrated (traceable to NIST) to within ±3% accuracy 2 sigma which means that 95% of the sensors are accurate within ±3%. However, if your application requires very high accuracy, we also offer something called “double calibration” which can bring the error down to ±2%.
Select the range that contains your wavelength. The sensors have coatings on them that have been characterized and for any wavelength within that range the sensor will be within calibration tolderance including variations in sensitivity within that range. When there is a difference in sensitivity that exceeds the allowable tolerances, a new wavelength range is created and a calibrated for.
There are a number of options, depending on the purpose.
- In many cases, the simplest solution could be to make use of the analog output of the meter – that gives a voltage signal proportional to the actual reading (it is in fact just a D/A translation of what is being displayed), so it represents a fully calibrated reading. The full scale value is a function of the meter being used and the power range it is on.
- The "SH to BNC connector" (Ophir P/N 7Z11010) simply takes the raw output from the detector element and sends it to the scope. It bypasses the sensor's EEROM which contains the calibration data, so it essentially turns the sensor into an uncalibrated "dumb" analog sensor. It should be noted, though, that in some cases we could be talking about a signal to the scope that may be low, perhaps even near the noise level of the scope, which limits the usefulness of this method at low powers.
- If the need is to see the pulse width – the temporal profile – the solution (assuming applicable specs) is to use an approprinte temporal sensor connected to a scope; you can point it anywhere where it will catch some backscatter from your laser, and you'll see the pulse temporal form as it really is.
First, clean the absorber surface with a tissue, using Umicore #2 Substrate Cleaner, acetone or methanol. Then dry the surface with another tissue. Please note that a few absorbers (Pyro-BB, 10K-W, 15K-W, 16K-W and 30K-W) cannot be cleaned with this method. Instead, simply blow off the dust with clean air or nitrogen. Don't touch these absorbers. Also, HE sensors (such as the 30(150)A-HE-17) should not be cleaned with acetone.
Note: These suggestions are made without guarantee. The cleaning process may result in scratching or staining of the surface in some cases and may also change the calibration.
For HE between 0.625 and 1um, the window transmits too much and the absorption drops by ~10%. Because of this, the thermal heat sink compound behind the absorber can dry out. If the power and energy is kept to 1/10 of maximum and the calibration is not important, the sensor can be used in this spectral region.
How long you fire the laser into the meter depends on you. Some manufacturers do it 100% of the time via a beam splitter. That way they have a constant feedback system to allow them to not only monitor the power output, but also to control it so the laser is stable. Other people only do it for a short time to verify the setting is producing the correct amount of power. For different applications different sensors would be needed. For continual monitoring we would recommend a sensor that is designed to have the laser on it all the time. For short time measurements, a sensor designed for short use would be more ideal. For lasers that are pulsed, we recommend firing the laser a couple of times to get an understanding of the pulse to pulse change as well as being able to monitor the average. However, some applications only want to verify the energy setting, so they only fire the laser once to see if they are ready to go. Again, the decision is up to you. Processing the information in the PLC is completely up to you. Usually this requires some form of calibration so you can take the information you are delivering to the PLC and correlate it with your operator display. I.e. Volts/Watt. How many Volts from the sensor is equal to X amount of Watts the laser just produced.
The 10K-W and 15K-W sensors are calibrated at wavelength 1.064μm, but since they relatively flat spectrally throughout the near infrared, this setting can be use anywhere in the spectral range 0.8 – 2μm. This is represented by the wavelength setting “NIR”. (They are also calibrated at 10.6um for CO2 lasers.)
Approximately 3.2% of the light impinging on the sensor is backscattered in a diffuse manner. The “Ophir 10K-W/15K-W Scatter Shield” (P/N 7Z08295) is available to reduce this effect. When it is installed on the front flange of the 10K-W or 15K-W, it will reduce the backscatter to about 0.9%, by absorbing much of the backscattered light and by reflecting some of it back into the sensor where that light is absorbed. The increased absorption with the shield causes the reading on the sensor to be slightly higher than without the shield. We have introduced a laser setting called NIRS to compensate for this. When using the scatter shield, set the laser setting to NIRS. Otherwise, leave it at NIR. The situation is similar for the 30K-W sensor; there the calibration is at 1070nm, and the settings are called “107” (for regular use) and “107S” (for use with the 30K-W Scatter Shield).