Multiple Beam Analysis with the NanoScan

Aligning the output of laser diode or fiber optic arrays can be quite challenging. One of the lesser known features of the Photon NanoScan slit profilers is the multibeam analysis capability. The NanoScan software allows the characterization of up to 16 simultaneous beams entering the aperture, allowing the user to examine and evaluate various standard beam parameters displayed within the automatically-determined or user-defined regions-of-interest (ROI) on any or all beams captured by NanoScan. This unique control and selection feature gives the user flexibility to single out one beam or to view the entire beam set. Multiple beam data is displayed on the screen and can be isolated in contiguous beam sections as they are collected.

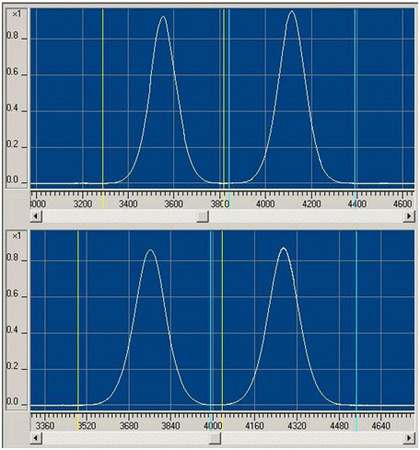
One important feature of the multiple beam analysis software is the ability to distinguish angular separation between any two simultaneous beams and display the results in real time in user defined units of milliradians or degrees. The software quickly, automatically, and accurately determines the respective angular separation parameters. The user can select the two beams of interest that are displayed for the angular separation calculations, whether or not they are shown contiguously.

Figure 1. Multiple Beam display showing two beams in two ROIs

When measuring multiple beams, the arrangement of the beams, the beam divergence, and the plane of measurement determine whether or not NanoScan can resolve them. In general, each beam in a linear array of collimated beams can be resolved. The measurement must be performed with the scan axes oriented at ±45° to the array. Also, it is useful to use the rotation transformation feature¹ in the NanoScan software to provide the beam positions in coordinates common to the linear array. When beams overlap, it is not possible to completely resolve the profiles. However, it is possible to extract information such as peak separation by manually defining specific ROIs around the beam peaks.

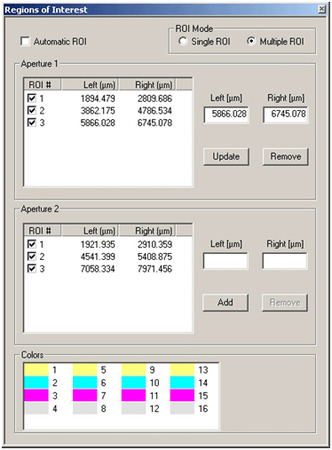
Figure 2. ROI Control showing definitions of 3 ROI positions in the aperture. The values are absolute position across the aperture (9000µm total aperture width)
  1. This is set in the Analysis Dialog Box: The beam centroid values are computed along the scanhead axis (default coordinate system). The rotation angle determines a new coordinate system, which is used for computing centroid position and separation. See section 5.1.5 in the NanoScan Manual.
Contact Us illustration

Have questions? Require assistance?

Click below to to contact Ophir Photonics and we'll get back with you shortly.

Contact Ophir Photonics