White Paper – Apples to Apples: Which Camera Technologies Work Best for Beam Profiling Applications, Part 3: Beam Aperturing Methods

In Part 2, we demonstrated the need for employing an accurately computed baseline and retaining both the positive and negative temporal noise inherent in the camera’s output data. We observed that for the most common beam width methods, preserving the noise moved each method closer to reality, even though many of these results are not always a very accurate second moment equivalent.

Author:

G.E. Slobodzian, Director of Engineering, Retired, Ophir-Spiricon

Part 1: New Camera Technologies

Part 2: Baseline Methods and Mode Effects

The ISO Solution

For direct second moment D4σ calculations, providing a proper baseline is only a partial answer. We observed that the noise in the outlying regions surrounding the beam can yield wild frame to frame differences for the same beam. Thus, it becomes imperative to remove this outlying noise to obtain an accurate second moment beam width. The method taught by ISO-11146-3 in 2004 recommended isolating the beam profile with an aperture 3x the second moment beam width. Ten years before this ISO publication, Spiricon was already working on how to resolve this problem and came to a similar but somewhat different result.

Part 2 demonstrated that the degraded signal to noise of a beam, modelled by a dimming beam profile, caused the second moment beam width results to gyrate wildly around its true value. In a similar way, reducing the size of the beam relative to the camera imager will have the same effect.

Real Cameras

Part 3 will investigate the aperture selection process using a state of the art CCD camera connected via a USB2 serial port. The camera is a Spiricon SP620 that outputs a 1600x1200 12 bit per pixel image format. The pixel pitch is 4.4μm² and the camera has a dynamic range of ~60dBrms. Real cameras will create outputs not quite as perfect as we modelled using the BeamMaker™ utility. The modelled beams and the modelled noise were mathematically perfect. The black level and noise of a real camera is a bit more complex.

Most cameras output some degree of imager shading and pixel to pixel offset variation. Temporal noise is reasonably Gaussian in distribution and is made up of imager, readout, amplifier, and digitizer noise. The readout noise will possess some random flutter in its distribution. This flutter can be observed by watching a histogram of the corrected baseline. Thermal effects can also be observed. The signal to noise tends to deteriorate with increase in temperature. And the black level baseline will also drift with temperature. Depending upon the camera design, some amount of power supply noise may also be observed in a black background. Cosmic rays passing thru the imager can generate false signals on one or groups of pixels.

No matter the source of the noise, the end result is that it is not possible to create a perfectly stable background using a real camera. What this means is that the background noise baseline will statistically bounce around a zero point, but never be zero. If camera temperatures are fluctuating, the baseline will also be observed to drift with the changes in imager temperature.

Figure 3-1 is a screen shot of a HeNe laser beam on the full size imager of the SP620. The beam’s peak intensity is just below camera saturation. The camera baseline has been Ultracal’d with the background indicating negative noise as a light grey and positive noise as dark purple.

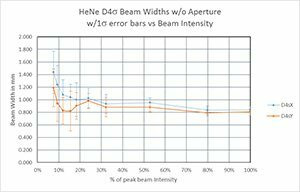
Figure 3-1. BeamGage image of a stable HeNe Laser on a Spiricon SP620 CCD camera.

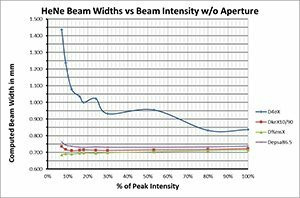
Without an aperture to restrict the calculation area, a plot of a dimming D4σ beam width result will look like the graph below. The data points are the results of 16 averaged samples and the error bars are plotted ±1 std dev.

All of the above beam width measurements are 10% or larger than the beams actual size. The increasing variability indicates that the background noise is shifted positive for all of the averaged results. The slightly positive shift could just as well be slightly negative, depending upon the luck of the draw. It is possible that the camera was still warming slightly as the above data was being collected. For comparison, below is a plot of the X-axis beam widths of the above data for 4 of the common beam width methods modelled in Part 2.

Figure 3-2. X/Y D4s beam width vs beam intensity with baseline correction, without an aperture.
Figure 3-3. X/Y D4s beam width vs beam intensity with baseline correction, without an aperture.

Based on the above results it appears that the actual beam width lies somewhere between .70 -.75mm.

Aperture Sizing

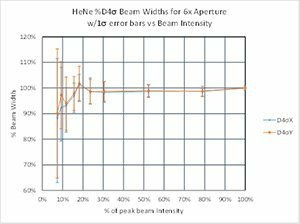
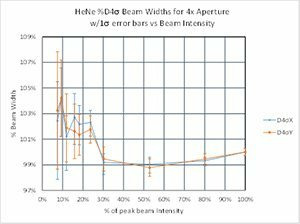
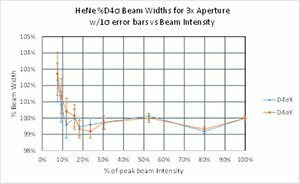
Now we will examine the same HeNe laser by applying fixed manual apertures at 6x, 4x, 3x, 2.5x and 2x the beam width. All graphs are normalized to the first sample at 100% intensity. Each graph is the results of a separate sample run and has been baseline corrected at the start of the run.

Figure 3-4a. 6x Aperture

6x - In Fig 3-4a, the 100% X/Y beam widths are .748mm and .756mm respectively. Both are at the high end of the .70-.75mm range. The error bars are quite large even at the 30% level.

Figure 3-4b. 4x Aperture

4x - In Fig 3-4b, the 100% X/Y beam widths are .736mm and .739mm respectively. The error bars are improving.

Figure 3-4c. 3x Aperture

3x - In Fig 3-4c, the 100% X/Y beam widths are .734mm and .735mm respectively. Both are in the middle of the .70- .75mm range. The error bars are under 1% at 24% intensity. This is the ISO recommended 3x aperture size and performs very well, yielding a very stable results over a large range of beam intensities.

Figure 3-4c. 2.5x Aperture

2.5x - In Fig 3-4d, the 100% X/Y beam widths are .733mm and .733mm, respectively. Both are in the middle of the .70- .75mm range. The error bars are under 1% at 12% intensity.

Figure 3-4c. 2x Aperture

2x - In Fig 3-4e, the 100% X/Y beam widths are .725mm and .726mm, respectively. Both are in the middle of the .70- .75mm range. The error bars are under 1% for the entire run. The beam width values are the lowest in the group and may be indicating that some of the beam is now being clipped by the aperture.

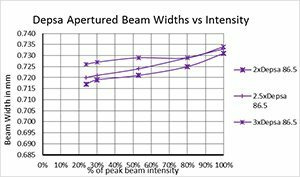
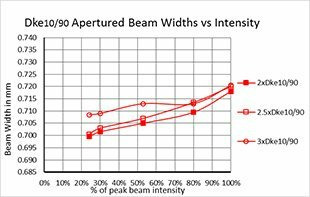
To complete our analysis of the above data, let’s also compare the beam widths reported by the Dke10/90, D%ms, and the Depsa methods plotted together with the D4s values, and then plotted separately. In the graphs below the results plotted are the average of the X and Y values for each method. We will now only consider apertures between 2x and 3x, since it is obvious that larger ones are not practical, and since no one has suggested anything larger than 3x.

Since we are measuring a near TEM00 HeNe laser, one would expect to find all of the results to be essentially the same. And indeed the spread from the highest to the lowest value is about ±3% from the median value.

Graph 3-5a indicates that the 3x aperture yields the flattest results over the intensity range for all measurement methods. Independent of aperture size, graphs 3-6a and 3-6b show that the D4s and Depsa methods yield the highest results for all beam intensities, and the D%ms method yields the lowest results. Spiricon’s Dke10/90 method falls neatly between, but closer to the lower D%ms method. As one might expect, the D4s method shows the largest variation with aperture size.

Since all of the results are computed from the same beam images within each aperture size, the small disagreements must be from very subtle noise effects riding on the beam and in the beam wings. The fact that most of the beam widths drop with intensity is just what one would expect since as the signal at the outer edges of the beam falls into the noise it becomes difficult to separate the real beam from the noise.

Based on these results, it appears that any aperture sized between 2 to 3x the beam width would yield good D4s results, while above 3x things become more unstable, as indicated by the increasing error bars in graphs 3-4a and 3-4b. So are there any other considerations that might impact the choice of what size aperture may be best? In the previous scenarios the beam had special characteristics. It was circular, nearly TEM00, and relatively large compared to the size of the pixels. So what happens if the beam is less ideal? If for example, the beam is dominated by higher modes, or is very small relative to the imager size. Below is a comparison of the 2x, 2.5x, and 3x aperture on a TEM00 beam compared to beams of higher modes.

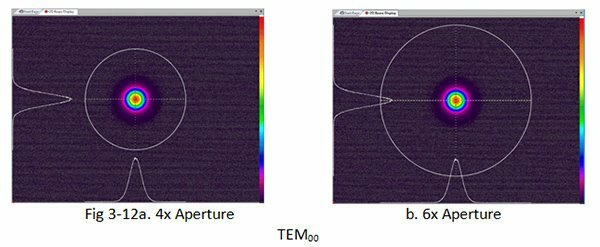
You can observe that for beams of higher modes, the 3x aperture, and to a lesser extent, the 2.5x aperture opens up a much larger area of background noise than does the 2x aperture. While the 2x aperture is a close fit to a TEM00, it none the less produced measurement accuracies well within acceptable ranges as noted in graph 3-5c. For comparison here’s what the 4x and 6x apertures look like on the TEM00.

We would never consider the 4x or 6x aperture appropriate for a TEM00 beam because the large open background causes the D4s results to suffer large swings due to noise and small background fluctuations. Yet these two apertures closely resemble the sizes for the 2.5x and 3x beams that contain higher modes. Of course, in reality few real lasers contain pure higher modes. It has been demonstrated that beams build higher modes in a more or less systematic way as their M² values increase, at the expense of the embedded TEM00 mode. Thus as the higher modes increase the structures become even more complex than what is demonstrated above. As the modes increase, the beam widths increase relative to the area the beam covers, and as a result, any multiplied aperture increases even faster.

So the above examples provide an answer to the question, which of the three favored apertures is a better choice over a wide range of possible beam modal scenarios - the 2x.

But what about really tiny beams? Just to make sure the reader doesn’t think we left out other possibilities, such as when the beam is very…very…very…small relative to the size of the camera imager. This has also been evaluated and the outcome is similar to what is observed for the larger beam, but with one caveat. As a beam gets very small relative to the imager, the background noise fluctuations become so serious that the entire beam aperture calculation method has a difficult time actually locating the beam and determining a meaningful beam width to multiply. Under this condition, the operator must provide some assistance by first isolating the beam with a manual drawn aperture, or by reducing the camera’s ROI (region of interest) to a window that more closely approximates the beam’s size and location.

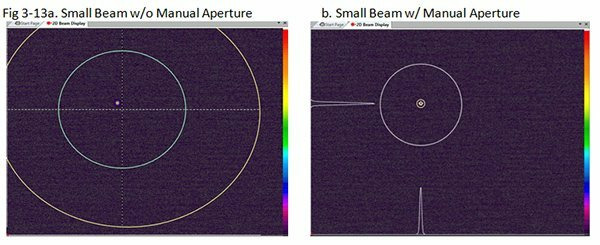
Below is an example of what this looks like, first without and then with a manual aperture. The beam is the same HeNe used in the earlier examples, but focused down to 97μm. It is so small it barely shows up when viewing the entire imager. Spiricon’s BeamGage® software and an SP620 CCD camera are used to capture the image, and the cursor is showing its approximate location and size in the slice profiles.

In both of the above images, the cursors are tracking the beam centroid. The calculated 2x aperture is in Yellow, while the size of the computed beam widths are displayed by the Green marker. The manual aperture is drawn in White. Figure 3-13a shows the small beam and the nonsense results based on the attempt to locate and size it. The noise is so dominant that the cursors cannot find the beam’s centroid. If you were to observe this in real-time the image would change dramatically from frame to frame as the attempts to find and measure the beam are randomly pushed around by the background noise.

In figure 3-13b, a simple manually drawn aperture has been placed around the beam. I drew it in without regard to its precise placement or size; just eyeballed it. BeamGage can now draw a good 2x aperture (the tiny yellow circle) and the cursors now easily locate and display the beam profiles. Here’s what it looks like if we zoom in just a bit. The computed beam width results are included so you can see how well the different methods agree.

Figure 3-14. Small Beam, Zoomed in, w/ Manual Aperture, 2x Auto Aperture and Results

Conclusions

We now end Part 3 of this paper with the following conclusions:

  • To obtain an accurate D4s beam width for beams of both TEM00 and higher modes, a reasonably good background baseline must be determined and that baseline must contain both positive and negative noise.
  • To measure beams that vary greatly in size and modal content, an isolating aperture must be employed and that aperture is best chosen to be 2x the second moment beam width in the beam’s X and Y-axes.
  • When beams become very small relative to the imager, a secondary manual aperture should be employed to isolate the background noise to a small region around the beam.

We did not discuss the topic of how the aperture should be shaped. ISO 11146-1 shows a square or rectangular shape, but does not actually come out and say it should be flat sided. It can be demonstrated that the extra noise in the corners of a square aperture do increase the standard deviation somewhat, especially if it is sized 3x the beam width. When we first designed our Auto Aperture system at Spiricon, we intuitively decided that the auto aperture should be elliptical in shape. We’ve kept that method and see no reason to change it. It may be that for some square shaped beams, especially Tophat Excimers, a rectangular shaped aperture might be more appropriate. The manual aperture tools in BeamGage allow you to choose between, Circular, Elliptical, Square, or Rectangular shapes. While this is not an Auto Aperture, it does provide the user with the option to use one of these manual aperture shapes instead of using the elliptical Auto Aperture.

Coming next:

In Part 4 we will explore the operation of our Photon scanning slit beam measurement products and compare them to camera-based systems.

References

  1. Carlos B Roundy, PhD; Techniques for Accurately Measuring Laser Beam Width with Commercial CCD Cameras, Spiricon, Inc., Logan, Utah 84341 USA, Presented At 4th International Workshop on Laser Beam and Optics Characterization
  2. Amiel A. Ishaaya, Nir Davidson, Galina Machavariani, Erez Hasman, and Asher A. Friesem; Efficient Selection of High-Order Laguerre–Gaussian Modes in a Q-Switched Nd :YAG Laser, IEEE JOURNAL OF QUANTUM ELECTRONICS, VOL. 39, NO. 1, JANUARY 2003
  3. CCD IMAGE SENSOR NOISE SOURCES, August 3, 2012 Reference Document Rev 1.0 PS-0047, TRUESENSE imaging, inc.
  4. Albert J.P. Theuwissen, Kleine Schoolstraat; Influence of Terrestrial Cosmic Rays on the Reliability of CCD Image Sensors, © 2005 IEEE
  5. ISO 11146-1:2005(E), Lasers and laser-related equipment —Test methods for laser beam widths, divergence angles and beam propagation ratios — Part 1:Stigmatic and simple astigmatic beams.
  6. ISO/TR 11146-3:2004(E), Lasers and laser-related equipment — Test methods for laser beam widths, divergence angles and beam propagation ratios — Part 3: Intrinsic and geometrical laser beam classification, propagation and details of test methods
  7. ISO/TR 11146-3:2004/Cor.1:2005(E), Lasers and laser-related equipment — Test methods for laser beam widths, divergence angles and beam propagation ratios — Part 3: Intrinsic and geometrical laser beam classification, propagation and details of test methods
  8. Ram Oron, Nir Davidson, Asher A. Friesem, Erez Hasman; Chapter 6 Transverse mode shaping and selection in laser resonators, E. Wolf, Progress in Optics 42 © 2001 Elsevier Science B. V
  9. A. E. Siegman; How to (Maybe) Measure Laser Beam Quality, Tutorial presentation at the Optical Society of America Annual Meeting Long Beach, California, October 1997
  10. Siegman, Sasnett, and Johnston; Choice of Clip Levels for Beam Width Measurements Using Knife-Edge, IEEE Journal of Quantum Electronics, Vol. 27, No. 4, April 1991
Contact Us illustration

Have questions? Require assistance?

Click below to to contact Ophir Photonics and we'll get back with you shortly.

Contact Ophir Photonics